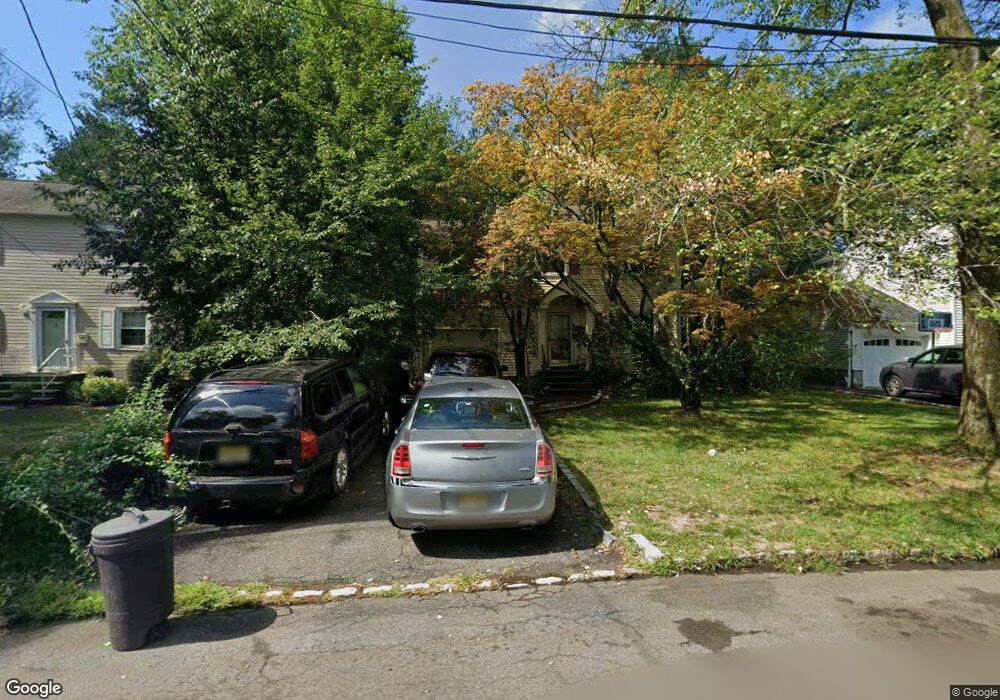
17 Concord Dr Livingston, NJ 07039
Estimated Value: $787,000 - $1,052,000
--
Bed
--
Bath
1,710
Sq Ft
$555/Sq Ft
Est. Value
About This Home
This home is located at 17 Concord Dr, Livingston, NJ 07039 and is currently estimated at $948,332, approximately $554 per square foot. 17 Concord Dr is a home located in Essex County with nearby schools including Livingston Sr High School and Aquinas Academy.
Ownership History
Date
Name
Owned For
Owner Type
Purchase Details
Closed on
Feb 27, 2007
Sold by
Pye Thomas
Bought by
Kurzer Gary
Current Estimated Value
Home Financials for this Owner
Home Financials are based on the most recent Mortgage that was taken out on this home.
Original Mortgage
$412,000
Outstanding Balance
$257,596
Interest Rate
6.87%
Mortgage Type
Adjustable Rate Mortgage/ARM
Estimated Equity
$690,736
Purchase Details
Closed on
Oct 28, 2002
Sold by
Waddon Patricia
Bought by
Pye Thomas and Pye Ilene
Home Financials for this Owner
Home Financials are based on the most recent Mortgage that was taken out on this home.
Original Mortgage
$210,000
Interest Rate
6.16%
Create a Home Valuation Report for This Property
The Home Valuation Report is an in-depth analysis detailing your home's value as well as a comparison with similar homes in the area
Home Values in the Area
Average Home Value in this Area
Purchase History
| Date | Buyer | Sale Price | Title Company |
|---|---|---|---|
| Kurzer Gary | $515,000 | -- | |
| Pye Thomas | $349,000 | -- |
Source: Public Records
Mortgage History
| Date | Status | Borrower | Loan Amount |
|---|---|---|---|
| Open | Kurzer Gary | $412,000 | |
| Previous Owner | Pye Thomas | $210,000 |
Source: Public Records
Tax History Compared to Growth
Tax History
| Year | Tax Paid | Tax Assessment Tax Assessment Total Assessment is a certain percentage of the fair market value that is determined by local assessors to be the total taxable value of land and additions on the property. | Land | Improvement |
|---|---|---|---|---|
| 2025 | $13,269 | $559,400 | $318,000 | $241,400 |
| 2024 | $13,269 | $559,400 | $318,000 | $241,400 |
| 2022 | $13,051 | $559,400 | $318,000 | $241,400 |
| 2021 | $12,945 | $559,400 | $318,000 | $241,400 |
| 2020 | $12,704 | $559,400 | $318,000 | $241,400 |
| 2019 | $11,793 | $450,800 | $303,000 | $147,800 |
| 2018 | $11,635 | $450,800 | $303,000 | $147,800 |
| 2017 | $11,482 | $450,800 | $303,000 | $147,800 |
| 2016 | $11,270 | $450,800 | $303,000 | $147,800 |
| 2015 | $11,103 | $450,800 | $303,000 | $147,800 |
| 2014 | $10,743 | $450,800 | $303,000 | $147,800 |
Source: Public Records
Map
Nearby Homes