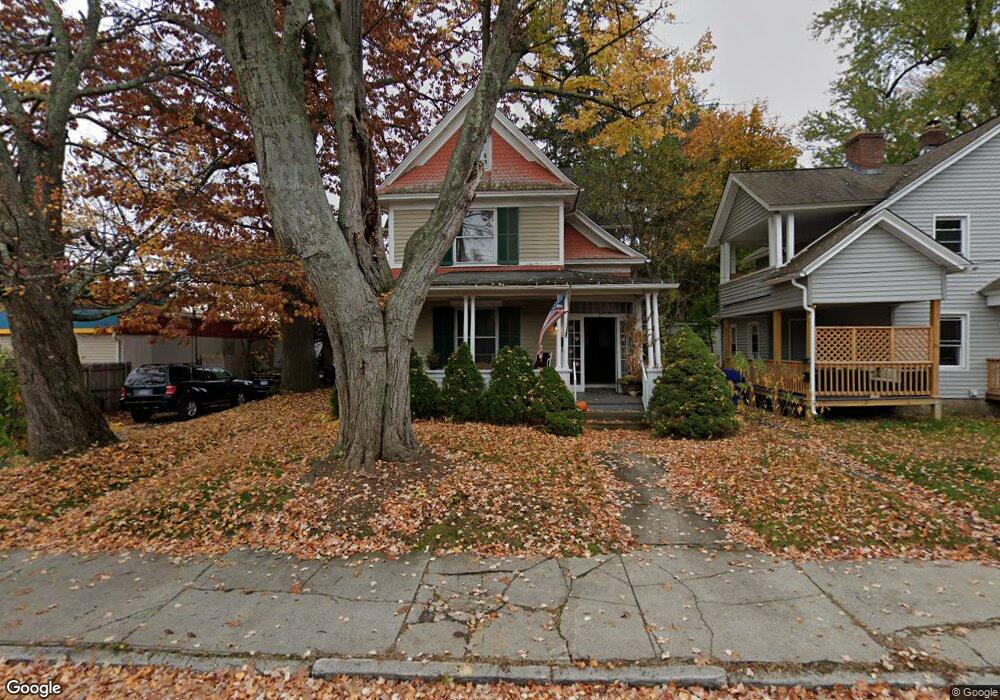
17 Cook St Torrington, CT 06790
Estimated Value: $248,000 - $305,000
4
Beds
3
Baths
2,070
Sq Ft
$136/Sq Ft
Est. Value
About This Home
This home is located at 17 Cook St, Torrington, CT 06790 and is currently estimated at $280,898, approximately $135 per square foot. 17 Cook St is a home located in Litchfield County with nearby schools including Torrington Middle School, Torrington High School, and St. Peter School.
Ownership History
Date
Name
Owned For
Owner Type
Purchase Details
Closed on
Jul 28, 2003
Sold by
Yurchick Tracy K
Bought by
Marquard David R and Marquard Sheryl A
Current Estimated Value
Home Financials for this Owner
Home Financials are based on the most recent Mortgage that was taken out on this home.
Original Mortgage
$103,500
Interest Rate
7.99%
Purchase Details
Closed on
Jan 16, 1997
Sold by
Mckenna Tr James F
Bought by
Yurchick Tracy K
Home Financials for this Owner
Home Financials are based on the most recent Mortgage that was taken out on this home.
Original Mortgage
$38,500
Interest Rate
6.5%
Mortgage Type
Unknown
Create a Home Valuation Report for This Property
The Home Valuation Report is an in-depth analysis detailing your home's value as well as a comparison with similar homes in the area
Home Values in the Area
Average Home Value in this Area
Purchase History
| Date | Buyer | Sale Price | Title Company |
|---|---|---|---|
| Marquard David R | $115,000 | -- | |
| Yurchick Tracy K | $55,000 | -- |
Source: Public Records
Mortgage History
| Date | Status | Borrower | Loan Amount |
|---|---|---|---|
| Open | Yurchick Tracy K | $106,600 | |
| Closed | Yurchick Tracy K | $103,500 | |
| Previous Owner | Yurchick Tracy K | $55,000 | |
| Previous Owner | Yurchick Tracy K | $38,500 | |
| Closed | Yurchick Tracy K | $13,750 |
Source: Public Records
Tax History
| Year | Tax Paid | Tax Assessment Tax Assessment Total Assessment is a certain percentage of the fair market value that is determined by local assessors to be the total taxable value of land and additions on the property. | Land | Improvement |
|---|---|---|---|---|
| 2025 | $7,523 | $195,650 | $20,160 | $175,490 |
| 2024 | $4,866 | $101,440 | $20,160 | $81,280 |
| 2023 | $4,865 | $101,440 | $20,160 | $81,280 |
| 2022 | $4,782 | $101,440 | $20,160 | $81,280 |
| 2021 | $4,683 | $101,440 | $20,160 | $81,280 |
| 2020 | $4,683 | $101,440 | $20,160 | $81,280 |
| 2019 | $4,191 | $90,770 | $20,160 | $70,610 |
| 2018 | $4,191 | $90,770 | $20,160 | $70,610 |
| 2017 | $4,153 | $90,770 | $20,160 | $70,610 |
| 2016 | $4,153 | $90,770 | $20,160 | $70,610 |
| 2015 | $4,153 | $90,770 | $20,160 | $70,610 |
| 2014 | $4,104 | $113,000 | $27,160 | $85,840 |
Source: Public Records
Map
Nearby Homes
Your Personal Tour Guide
Ask me questions while you tour the home.