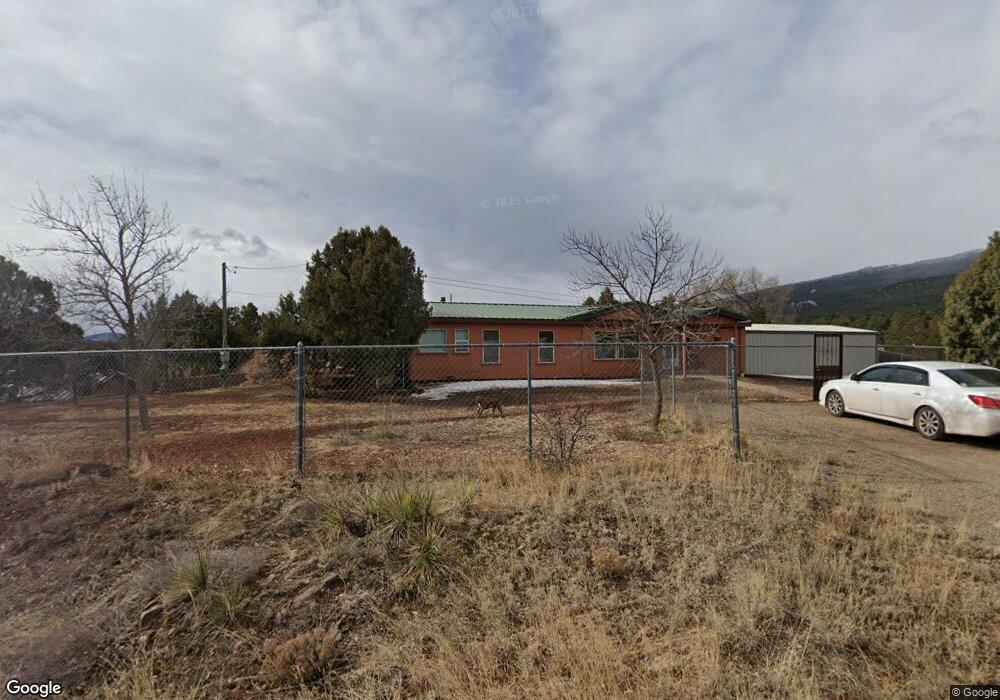
17 Corte de Canoncito Cedar Crest, NM 87008
Estimated Value: $378,476 - $429,000
3
Beds
2
Baths
1,596
Sq Ft
$254/Sq Ft
Est. Value
About This Home
This home is located at 17 Corte de Canoncito, Cedar Crest, NM 87008 and is currently estimated at $405,369, approximately $253 per square foot. 17 Corte de Canoncito is a home located in Bernalillo County with nearby schools including San Antonito Elementary School, Roosevelt Middle School, and Manzano High School.
Ownership History
Date
Name
Owned For
Owner Type
Purchase Details
Closed on
Jul 30, 2019
Sold by
Ousley D Hal and Ousley Lynnette R
Bought by
Butler Michal and Butler Shelly
Current Estimated Value
Home Financials for this Owner
Home Financials are based on the most recent Mortgage that was taken out on this home.
Original Mortgage
$187,150
Outstanding Balance
$163,960
Interest Rate
3.82%
Mortgage Type
New Conventional
Estimated Equity
$241,409
Purchase Details
Closed on
Sep 20, 2007
Sold by
Willis Jimmie D and Janet Willis K
Bought by
Ousley D Hal and Ousley Lynnette R
Home Financials for this Owner
Home Financials are based on the most recent Mortgage that was taken out on this home.
Original Mortgage
$175,000
Interest Rate
6.5%
Mortgage Type
Purchase Money Mortgage
Purchase Details
Closed on
Nov 18, 2000
Sold by
Willis Kelly W and Willis Stephanie K
Bought by
Willis Jim D and Janet Willis K
Create a Home Valuation Report for This Property
The Home Valuation Report is an in-depth analysis detailing your home's value as well as a comparison with similar homes in the area
Purchase History
| Date | Buyer | Sale Price | Title Company |
|---|---|---|---|
| Butler Michal | -- | Fidelity National Ttl Ins Co | |
| Ousley D Hal | -- | First American Title Ins Co | |
| Willis Jim D | -- | Southwestern Title & Escrow |
Source: Public Records
Mortgage History
| Date | Status | Borrower | Loan Amount |
|---|---|---|---|
| Open | Butler Michal | $187,150 | |
| Previous Owner | Ousley D Hal | $175,000 |
Source: Public Records
Tax History
| Year | Tax Paid | Tax Assessment Tax Assessment Total Assessment is a certain percentage of the fair market value that is determined by local assessors to be the total taxable value of land and additions on the property. | Land | Improvement |
|---|---|---|---|---|
| 2025 | $1,530 | $50,495 | $11,599 | $38,896 |
| 2024 | $1,950 | $64,573 | $12,674 | $51,899 |
| 2023 | $1,920 | $62,693 | $12,305 | $50,388 |
| 2022 | $1,855 | $60,867 | $11,947 | $48,920 |
| 2021 | $1,793 | $59,094 | $11,599 | $47,495 |
| 2020 | $1,817 | $59,094 | $11,599 | $47,495 |
| 2019 | $1,351 | $43,929 | $11,599 | $32,330 |
| 2018 | $1,344 | $43,929 | $11,599 | $32,330 |
| 2017 | $1,313 | $44,029 | $11,599 | $32,430 |
| 2016 | $1,309 | $44,529 | $11,599 | $32,930 |
| 2015 | $44,482 | $44,482 | $14,740 | $29,742 |
| 2014 | $1,302 | $43,186 | $14,311 | $28,875 |
| 2013 | -- | $41,929 | $13,894 | $28,035 |
Source: Public Records
Map
Nearby Homes
- 7 Corte de Canoncito
- 10 Francisco Rd
- 31 & 37 Bilotto Dr
- 0 N 14 Hwy Unit 1096048
- 76 Canoncito
- 0 Melcor de Canoncito Unit 1098582
- 143 Sangre de Cristo
- 10 Vera Cruz
- 5 Sycamore Dr
- 12141 New Mexico 14
- 50 54 56 Juniper Hill Loop
- 27 Sycamore Dr
- 78 Sangre de Cristo
- 2 Cedar Hill Place
- 14 & 18 Aspen Loop
- 4 Juniper Ct NE
- 3 Oak Place
- 5 Pine Tree Ct
- 13 Pinon Ave
- 121 Rincon Loop Rd
- 13 Corte de Canoncito
- 16 Corte de Canoncito
- 18 Corte de Canoncito
- 14 Corte de Canoncito
- 19 Corte de Canoncito
- 22 Corte de Canoncito
- 4 Corte de Canoncito
- 9 Corte de Canoncito
- 23 Corte de Canoncito
- 24 Corte de Canoncito
- 3 Corte de Canoncito
- 3 Kennedy
- 15 Kennedy
- 5 Corte de Canoncito
- 29 Corte de Canoncito
- 5 Francisco Rd
- 28 Corte de Canoncito
- 21 Kennedy
- 6 Francisco Rd
- 8 Kennedy
Your Personal Tour Guide
Ask me questions while you tour the home.