17 Cove Dr Niantic, CT 06357
Niantic NeighborhoodEstimated Value: $367,000 - $499,000
4
Beds
2
Baths
1,210
Sq Ft
$356/Sq Ft
Est. Value
About This Home
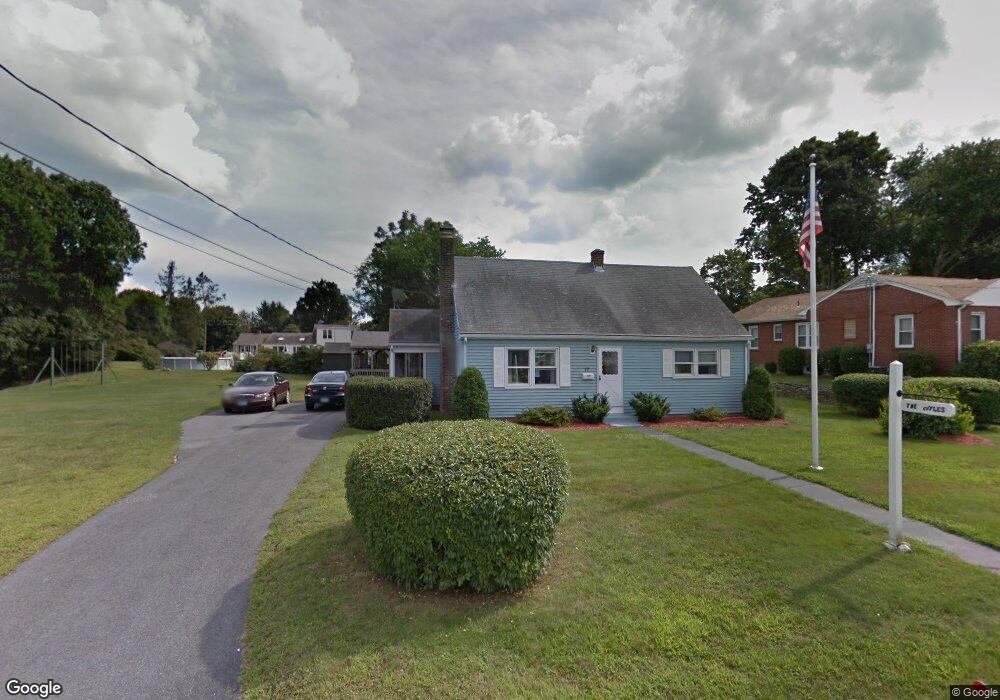
This home is located at 17 Cove Dr, Niantic, CT 06357 and is currently estimated at $430,160, approximately $355 per square foot. 17 Cove Dr is a home located in New London County with nearby schools including East Lyme Middle School, East Lyme High School, and The Light House Voc-Ed Center.
Ownership History
Date
Name
Owned For
Owner Type
Purchase Details
Closed on
Apr 22, 2022
Sold by
Coyle Dorothy I Est and Coyle
Bought by
Nahass Joseph J
Current Estimated Value
Home Financials for this Owner
Home Financials are based on the most recent Mortgage that was taken out on this home.
Original Mortgage
$160,000
Outstanding Balance
$149,558
Interest Rate
4.42%
Mortgage Type
Purchase Money Mortgage
Estimated Equity
$280,602
Create a Home Valuation Report for This Property
The Home Valuation Report is an in-depth analysis detailing your home's value as well as a comparison with similar homes in the area
Home Values in the Area
Average Home Value in this Area
Purchase History
| Date | Buyer | Sale Price | Title Company |
|---|---|---|---|
| Nahass Joseph J | $250,000 | None Available | |
| Nahass Joseph J | $250,000 | None Available |
Source: Public Records
Mortgage History
| Date | Status | Borrower | Loan Amount |
|---|---|---|---|
| Open | Nahass Joseph J | $160,000 | |
| Closed | Nahass Joseph J | $160,000 |
Source: Public Records
Tax History
| Year | Tax Paid | Tax Assessment Tax Assessment Total Assessment is a certain percentage of the fair market value that is determined by local assessors to be the total taxable value of land and additions on the property. | Land | Improvement |
|---|---|---|---|---|
| 2025 | $5,702 | $203,560 | $108,290 | $95,270 |
| 2024 | $5,364 | $203,560 | $108,290 | $95,270 |
| 2023 | $5,065 | $203,560 | $108,290 | $95,270 |
| 2022 | $4,853 | $203,560 | $108,290 | $95,270 |
| 2021 | $4,269 | $149,730 | $84,280 | $65,450 |
| 2020 | $4,246 | $149,730 | $84,280 | $65,450 |
| 2019 | $4,221 | $149,730 | $84,280 | $65,450 |
| 2018 | $4,095 | $149,730 | $84,280 | $65,450 |
| 2017 | $3,917 | $149,730 | $84,280 | $65,450 |
| 2016 | $3,797 | $149,730 | $84,280 | $65,450 |
| 2015 | $3,700 | $149,730 | $84,280 | $65,450 |
| 2014 | $3,598 | $149,730 | $84,280 | $65,450 |
Source: Public Records
Map
Nearby Homes
- 47 Oswegatchie Hills Rd
- 185 Main St Unit 301
- 185 Main St Unit 305
- 20 North Rd
- 468 Main St Unit 318
- 468 Main St Unit 111
- 46 Village Crossing Unit 46
- 47 Village Crossing Unit 47
- 3 E Wood St
- 37 Stoneywood Dr
- 10 S Ledge Rock Rd
- 42 S Washington Ave
- 52B Millstone Rd W
- 97 W Main St Unit 36
- 82 Roxbury Rd
- 80 Roxbury Rd
- 127 Black Point Rd Unit 7
- 43 Roxbury Ct
- 6 Fulmore Dr
- 55 Corey Ln
Your Personal Tour Guide
Ask me questions while you tour the home.