NOT LISTED FOR SALE

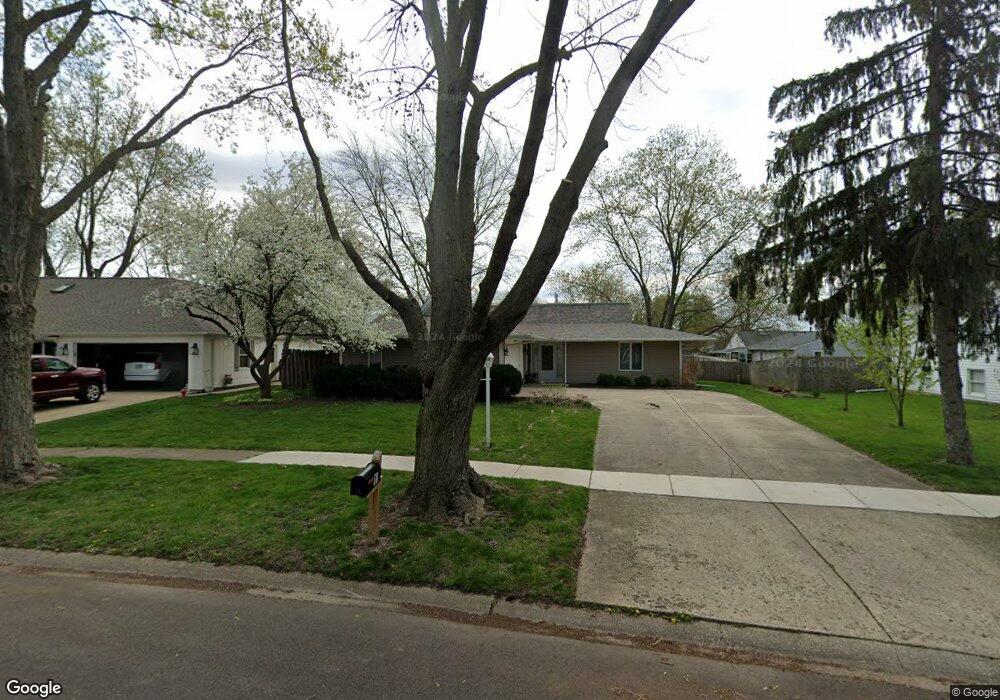
Estimated Value: $332,400 - $347,000

3 Beds
2 Baths
1,602 Sq Ft
$212/Sq Ft Est. Value

Last Sold November 14, 2012

Last sale price $155,000 $97 Per Sq Ft

Est. 120% increase in value since last sale

Current estimated payment $2,381/month

About This Home

As of November 2012

THIS 3 BDRM. OSWEGO RANCH IS IN MOVE IN CONDITION FOR A NEW FAMILY,NEUTRAL THRU-OUT! MASTER SUITE W/ FULL BA. & WALK - IN CLOSET. FORMAL LR/DR. EAT-IN KIT. ADJACENT TO FAM ROOM, GENEROUS LAUNDRY W/UT TUB, PANTRY, EXT.DOOR & DOOR TO ATT. 2 CAR GAR,NOTE ROOM SIZES,NEW ARCH. ROOF INSTALLED IN AUG. 2012, TEAR-OFF SHINGLES

Ownership History

Date Name Owned For Owner Type

Purchase Details

Listed on
Jun 18, 2012
Closed on
Nov 9, 2012
Sold by
Miller Shirley M
Bought by
Mccarthy Meegan M
Seller's Agent
Bonnie Stupak
REMAX Town & Country
Buyer's Agent
Mary Ann Sammons
Coldwell Banker Honig-Bell
List Price
$189,900
Sold Price
$155,000
Premium/Discount to List
-$34,900
-18.38%
Current Estimated Value
$340,350

Home Financials for this Owner

Home Financials are based on the most recent Mortgage that was taken out on this home.
Estimated Appreciation
$185,350
Avg. Annual Appreciation
6.28%
Original Mortgage
$124,000
Outstanding Balance
$85,605
Interest Rate
3.37%
Mortgage Type
New Conventional
Estimated Equity
$254,745
Source: Public Records

Range of Values:

Collateral Analytics

Collateral Analytics Collateral Analytics AVMs (Automated Valuation Model) employ a number of statistical approaches combined with neighborhood-specific comparable selection guarantees the most up-to-date and precise valuations.

Not Available

Collateral Analytics does not have data for the current month. Please view the chart for historical values.

ICE

ICE Mortgage Technology ICE Mortgage Technology’s AVM (Automated Valuation Model) is a state-of-the-art online residential property valuation tool that provides a quick and accurate estimate of the value of almost any home in the U.S.

Not Available

ICE Mortgage Technology does not have data for the current month. Please view the chart for historical values.

First American

First American First American Data & Analytics’ next-generation AVM combines unrivaled data assets with a blended ensemble of valuation models to produce highly accurate, reliable valuations you can trust.

Not Available

First American does not have data for the current month. Please view the chart for historical values.

Quantarium

Quantarium Quantarium’s valuation service, repeatedly proven the industry’s most accurate and comprehensive, is supercharged with a self-learning and auto-tuning AI engine that continually becomes smarter and more accurate as it processes daily inputs from the industry’s leading RE data lake.

Not Available

Quantarium does not have data for the current month. Please view the chart for historical values.

Average Value
Not Available
List Price
Sold Price
Create a Home Valuation Report for This Property
The Home Valuation Report is an in-depth analysis detailing your home's value as well as a comparison with similar homes in the area

Home Values in the Area

Source: Public Records

Average Home Value in this Area


Source: Public Records

Purchase History

Date Buyer Sale Price Title Company
Mccarthy Meegan M $155,000 Chicago Title Insurance Co
Source: Public Records

Mortgage History

Date Status Borrower Loan Amount
Open Mccarthy Meegan M $124,000
Source: Public Records

Property History

Date Event Price List to Sale Price per Sq Ft Prior Sale
11/14/2012 11/14/12 Sold $155,000 -11.4% $97 / Sq Ft View Prior Sale
10/08/2012 10/08/12 Pending -- -- --
09/12/2012 09/12/12 Price Changed $174,900 -2.8% $109 / Sq Ft
08/22/2012 08/22/12 Price Changed $179,900 -5.3% $112 / Sq Ft
06/18/2012 06/18/12 For Sale $189,900 -- $119 / Sq Ft

Tax History Compared to Growth

Source: Public Records

Tax History

Year Tax Paid Tax Assessment Tax Assessment Total Assessment is a certain percentage of the fair market value that is determined by local assessors to be the total taxable value of land and additions on the property. Land Improvement
2024 $6,923 $92,034 $23,322 $68,712
2023 $6,999 $89,354 $22,643 $66,711
2022 $6,999 $83,509 $21,162 $62,347
2021 $6,741 $78,046 $19,778 $58,268
2020 $6,524 $75,044 $19,017 $56,027
2019 $6,628 $75,044 $19,017 $56,027
2018 $6,050 $68,477 $17,353 $51,124
2017 $5,855 $63,113 $15,994 $47,119
2016 $5,398 $57,901 $14,673 $43,228
2015 $5,194 $53,612 $13,586 $40,026
2014 -- $51,550 $13,063 $38,487
2013 -- $54,264 $13,751 $40,513
Source: Public Records

Agents Affiliated with this Home

See All Agents

Map