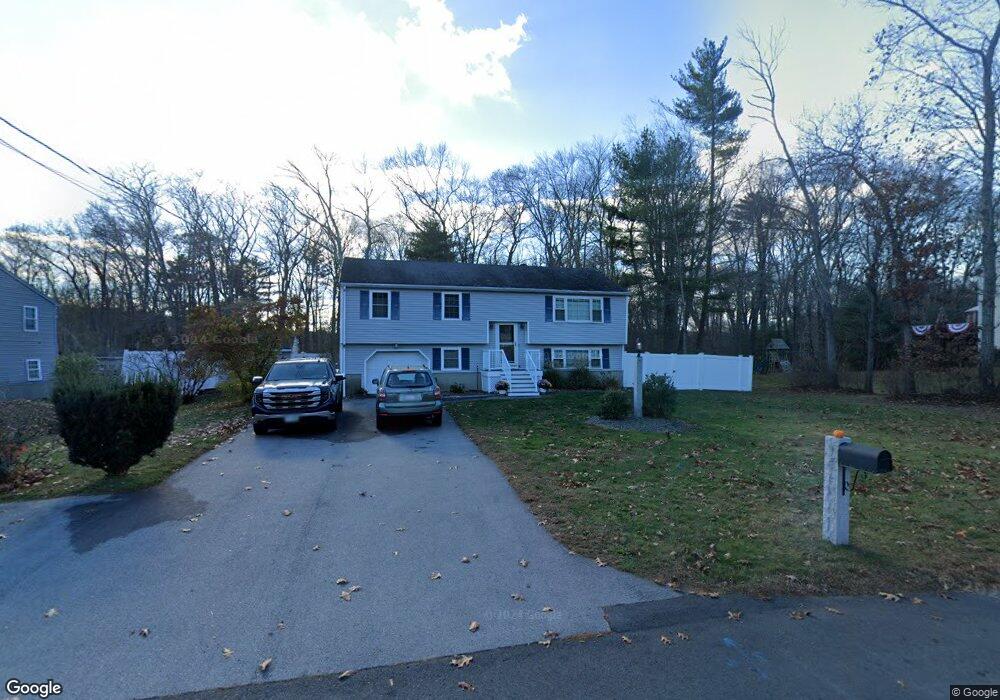
17 Cushing St Salisbury, MA 01952
Estimated Value: $586,000 - $732,000
5
Beds
2
Baths
2,165
Sq Ft
$301/Sq Ft
Est. Value
About This Home
This home is located at 17 Cushing St, Salisbury, MA 01952 and is currently estimated at $651,758, approximately $301 per square foot. 17 Cushing St is a home located in Essex County with nearby schools including Triton Regional High School and River Valley Charter School.
Ownership History
Date
Name
Owned For
Owner Type
Purchase Details
Closed on
Nov 12, 2021
Sold by
Turnage Bryan S
Bought by
Turnage Bryan S and Turnage Sherry L
Current Estimated Value
Home Financials for this Owner
Home Financials are based on the most recent Mortgage that was taken out on this home.
Original Mortgage
$183,133
Outstanding Balance
$140,116
Interest Rate
2.23%
Mortgage Type
New Conventional
Estimated Equity
$511,642
Purchase Details
Closed on
Nov 3, 2011
Sold by
Foster Sharon A
Bought by
Turnage Bryan S
Home Financials for this Owner
Home Financials are based on the most recent Mortgage that was taken out on this home.
Original Mortgage
$247,203
Interest Rate
4.08%
Mortgage Type
Purchase Money Mortgage
Purchase Details
Closed on
Oct 26, 1993
Sold by
Henigan Rose and Henigan Cynthia
Bought by
Foster Wayne S and Foster Sharon
Create a Home Valuation Report for This Property
The Home Valuation Report is an in-depth analysis detailing your home's value as well as a comparison with similar homes in the area
Home Values in the Area
Average Home Value in this Area
Purchase History
| Date | Buyer | Sale Price | Title Company |
|---|---|---|---|
| Turnage Bryan S | -- | None Available | |
| Turnage Bryan S | -- | None Available | |
| Turnage Bryan S | $242,000 | -- | |
| Foster Wayne S | $127,000 | -- | |
| Turnage Bryan S | $242,000 | -- | |
| Foster Wayne S | $127,000 | -- |
Source: Public Records
Mortgage History
| Date | Status | Borrower | Loan Amount |
|---|---|---|---|
| Open | Turnage Bryan S | $183,133 | |
| Closed | Turnage Bryan S | $183,133 | |
| Previous Owner | Foster Wayne S | $247,203 | |
| Previous Owner | Foster Wayne S | $106,000 |
Source: Public Records
Tax History
| Year | Tax Paid | Tax Assessment Tax Assessment Total Assessment is a certain percentage of the fair market value that is determined by local assessors to be the total taxable value of land and additions on the property. | Land | Improvement |
|---|---|---|---|---|
| 2025 | $4,863 | $482,400 | $165,600 | $316,800 |
| 2024 | $4,667 | $446,600 | $165,600 | $281,000 |
| 2023 | $4,479 | $414,700 | $165,600 | $249,100 |
| 2022 | $4,181 | $375,300 | $149,100 | $226,200 |
| 2021 | $3,965 | $352,100 | $149,100 | $203,000 |
| 2020 | $3,613 | $315,300 | $149,100 | $166,200 |
| 2019 | $3,534 | $298,000 | $144,900 | $153,100 |
| 2018 | $3,384 | $287,300 | $135,100 | $152,200 |
| 2017 | $3,291 | $276,100 | $124,200 | $151,900 |
| 2016 | $3,100 | $265,600 | $120,100 | $145,500 |
| 2015 | $2,930 | $249,400 | $111,800 | $137,600 |
Source: Public Records
Map
Nearby Homes
- 2 True Rd
- 9 Meadowview Ln Unit A
- 14 Meadowview Ln Unit B
- 16 Meadowview Ln Unit B
- 57 Baker Rd
- 42 Kendell Ln
- 14 Seabrook Rd
- 154 Lafayette Rd
- 25 Bayberry Ln
- 48 Beach Rd Unit C
- 191 Elm St
- 7 Toll Rd
- 3 Lighthouse Cir Unit A
- 6 Mason Ln
- 44 Seabrook Rd
- 53 Rabbit Rd
- 188 Lafayette Rd
- 86 Ferry Rd
- 1 Jefferson St
- 84 Forest Rd
Your Personal Tour Guide
Ask me questions while you tour the home.