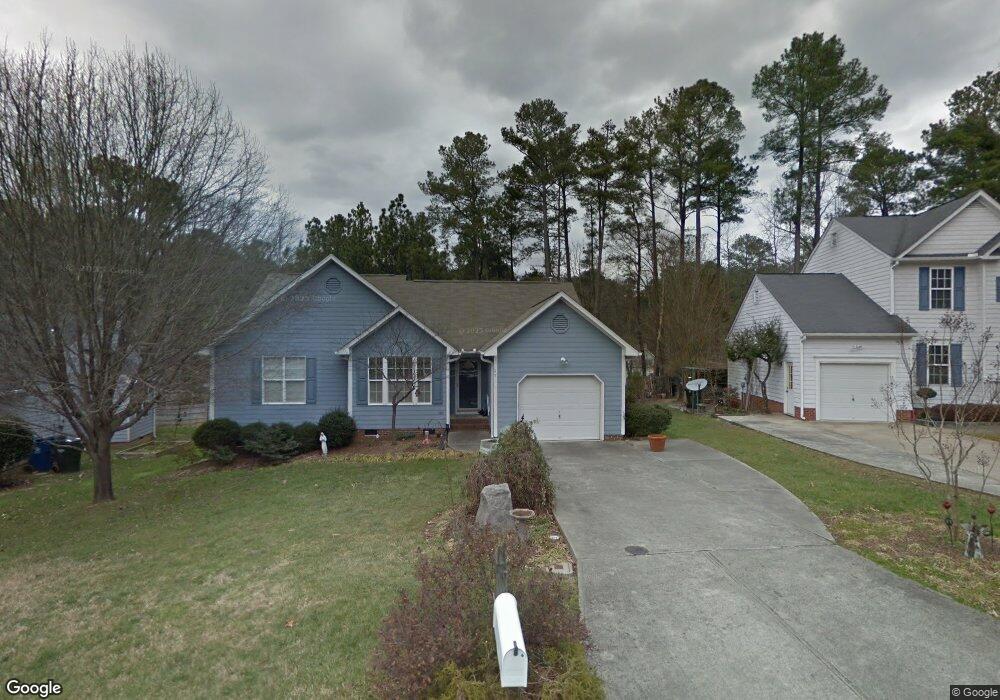
17 Dardanelle Ln Durham, NC 27713
Woodcroft NeighborhoodEstimated Value: $418,567 - $463,000
3
Beds
2
Baths
1,374
Sq Ft
$323/Sq Ft
Est. Value
About This Home
This home is located at 17 Dardanelle Ln, Durham, NC 27713 and is currently estimated at $443,642, approximately $322 per square foot. 17 Dardanelle Ln is a home located in Durham County with nearby schools including Pearsontown Elementary School, Lowe's Grove Middle, and Hillside High School.
Ownership History
Date
Name
Owned For
Owner Type
Purchase Details
Closed on
Mar 22, 2017
Sold by
Jordan Elizabeth Lee Ochsn
Bought by
Zhixing Cai and Yixuan Xing
Current Estimated Value
Home Financials for this Owner
Home Financials are based on the most recent Mortgage that was taken out on this home.
Original Mortgage
$100,000
Outstanding Balance
$51,155
Interest Rate
4.23%
Mortgage Type
New Conventional
Estimated Equity
$392,487
Purchase Details
Closed on
Mar 19, 2007
Sold by
Conner Sheree P and Conner Marty S
Bought by
Jordan Elizabeth O
Home Financials for this Owner
Home Financials are based on the most recent Mortgage that was taken out on this home.
Original Mortgage
$128,000
Interest Rate
6.27%
Mortgage Type
Purchase Money Mortgage
Purchase Details
Closed on
Aug 13, 1998
Sold by
Homes By Huff & Co Inc
Bought by
Robbins Sheree P
Home Financials for this Owner
Home Financials are based on the most recent Mortgage that was taken out on this home.
Original Mortgage
$124,450
Interest Rate
6.92%
Create a Home Valuation Report for This Property
The Home Valuation Report is an in-depth analysis detailing your home's value as well as a comparison with similar homes in the area
Home Values in the Area
Average Home Value in this Area
Purchase History
| Date | Buyer | Sale Price | Title Company |
|---|---|---|---|
| Zhixing Cai | $233,000 | -- | |
| Jordan Elizabeth O | $185,000 | None Available | |
| Robbins Sheree P | $132,000 | -- |
Source: Public Records
Mortgage History
| Date | Status | Borrower | Loan Amount |
|---|---|---|---|
| Open | Zhixing Cai | $100,000 | |
| Previous Owner | Jordan Elizabeth O | $128,000 | |
| Previous Owner | Robbins Sheree P | $124,450 |
Source: Public Records
Tax History Compared to Growth
Tax History
| Year | Tax Paid | Tax Assessment Tax Assessment Total Assessment is a certain percentage of the fair market value that is determined by local assessors to be the total taxable value of land and additions on the property. | Land | Improvement |
|---|---|---|---|---|
| 2025 | $3,269 | $424,206 | $152,100 | $272,106 |
| 2024 | $3,269 | $234,332 | $43,912 | $190,420 |
| 2023 | $3,070 | $234,332 | $43,912 | $190,420 |
| 2022 | $2,999 | $234,332 | $43,912 | $190,420 |
| 2021 | $2,985 | $234,332 | $43,912 | $190,420 |
| 2020 | $2,915 | $234,332 | $43,912 | $190,420 |
| 2019 | $2,915 | $234,332 | $43,912 | $190,420 |
| 2018 | $2,733 | $201,467 | $38,057 | $163,410 |
| 2017 | $2,713 | $201,467 | $38,057 | $163,410 |
| 2016 | $2,621 | $201,467 | $38,057 | $163,410 |
| 2015 | $2,521 | $182,126 | $37,119 | $145,007 |
| 2014 | $2,521 | $182,126 | $37,119 | $145,007 |
Source: Public Records
Map
Nearby Homes
- 227 Obie Dr
- 311 Denton St
- 309 Ebon Rd
- 5700 Barbee Rd
- 311 Ebon Rd
- 402 Carpenter Fletcher Rd
- 5708 Catskill Ct
- 33 Juliette Dr
- 5340 Fayetteville Rd
- 6 Chelan Ct
- 13 Byerly Ct
- 6004 Tahoe Dr
- 6304 Forest Ridge Dr
- 5624 Barbee Rd
- 17 Great Oak Ct
- 5205 Kemmont Dr
- 6502 Barbee Rd
- 5429 Fortunes Ridge Dr
- 12 Cobble Glen Ct
- 118 Fallenwood Ave