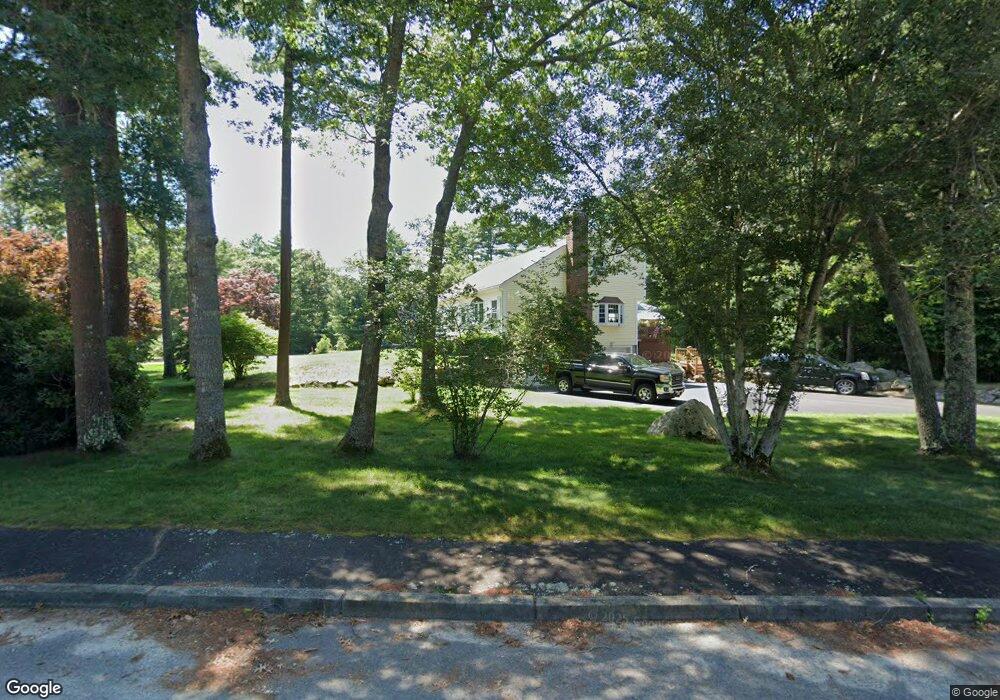
17 Dinahs Way Wareham, MA 02571
Estimated Value: $634,000 - $774,000
4
Beds
3
Baths
2,600
Sq Ft
$261/Sq Ft
Est. Value
About This Home
This home is located at 17 Dinahs Way, Wareham, MA 02571 and is currently estimated at $678,549, approximately $260 per square foot. 17 Dinahs Way is a home located in Plymouth County with nearby schools including Tabor Academy.
Ownership History
Date
Name
Owned For
Owner Type
Purchase Details
Closed on
Dec 13, 2021
Sold by
Feeney Timothy M and Feeney Heather A
Bought by
Feeny Lt and Feeney
Current Estimated Value
Purchase Details
Closed on
Jul 10, 2001
Sold by
Mcnair Richard H and Mcnair Kim M
Bought by
Feeny Timothy M and Feeny Heather A
Purchase Details
Closed on
Apr 28, 1999
Sold by
Mcbride Maxine and Harkins Catherine
Bought by
Mcnair Richard H and Mcnair Kim M
Create a Home Valuation Report for This Property
The Home Valuation Report is an in-depth analysis detailing your home's value as well as a comparison with similar homes in the area
Purchase History
| Date | Buyer | Sale Price | Title Company |
|---|---|---|---|
| Feeny Lt | -- | None Available | |
| Feeny Lt | -- | None Available | |
| Feeny Timothy M | $254,900 | -- | |
| Feeny Timothy M | $254,900 | -- | |
| Mcnair Richard H | $161,000 | -- | |
| Mcnair Richard H | $161,000 | -- |
Source: Public Records
Mortgage History
| Date | Status | Borrower | Loan Amount |
|---|---|---|---|
| Previous Owner | Mcnair Richard H | $200,000 | |
| Previous Owner | Mcnair Richard H | $50,000 | |
| Previous Owner | Mcnair Richard H | $225,000 |
Source: Public Records
Tax History
| Year | Tax Paid | Tax Assessment Tax Assessment Total Assessment is a certain percentage of the fair market value that is determined by local assessors to be the total taxable value of land and additions on the property. | Land | Improvement |
|---|---|---|---|---|
| 2025 | $6,050 | $580,600 | $137,100 | $443,500 |
| 2024 | $6,400 | $569,900 | $109,800 | $460,100 |
| 2023 | $5,541 | $505,300 | $100,100 | $405,200 |
| 2022 | $5,541 | $420,400 | $100,100 | $320,300 |
| 2021 | $5,453 | $405,400 | $100,100 | $305,300 |
| 2020 | $5,177 | $390,400 | $100,100 | $290,300 |
| 2019 | $5,042 | $379,400 | $103,300 | $276,100 |
| 2018 | $4,634 | $340,000 | $103,300 | $236,700 |
| 2017 | $4,441 | $330,200 | $103,300 | $226,900 |
| 2016 | $4,208 | $311,000 | $98,900 | $212,100 |
| 2015 | $4,065 | $311,000 | $98,900 | $212,100 |
| 2014 | $3,818 | $297,100 | $107,900 | $189,200 |
Source: Public Records
Map
Nearby Homes
- 6 Bourne Terrace
- 10 Longmeadow Dr
- 233 Marion Rd
- 437 Main St
- 7 Maud Palmer Dr
- 1 Emma Ln Unit B
- 15 14th Ave
- 9 Woodville Way
- 110 Mayflower Ridge Dr
- 19 Station St
- 17 Station St
- 4 Mather Dr
- 2645 Cranberry Hwy Unit A
- 15 Broadmarsh Ave
- 12 Oakdale St
- 6 Allen Ave
- 20 Grant St
- 43 Shore Ave
- 6 Wildwood Ave
- 189 Pine View Terrace
Your Personal Tour Guide
Ask me questions while you tour the home.