Estimated Value: $286,277 - $453,000
Studio
--
Bath
1,602
Sq Ft
$240/Sq Ft
Est. Value
About This Home
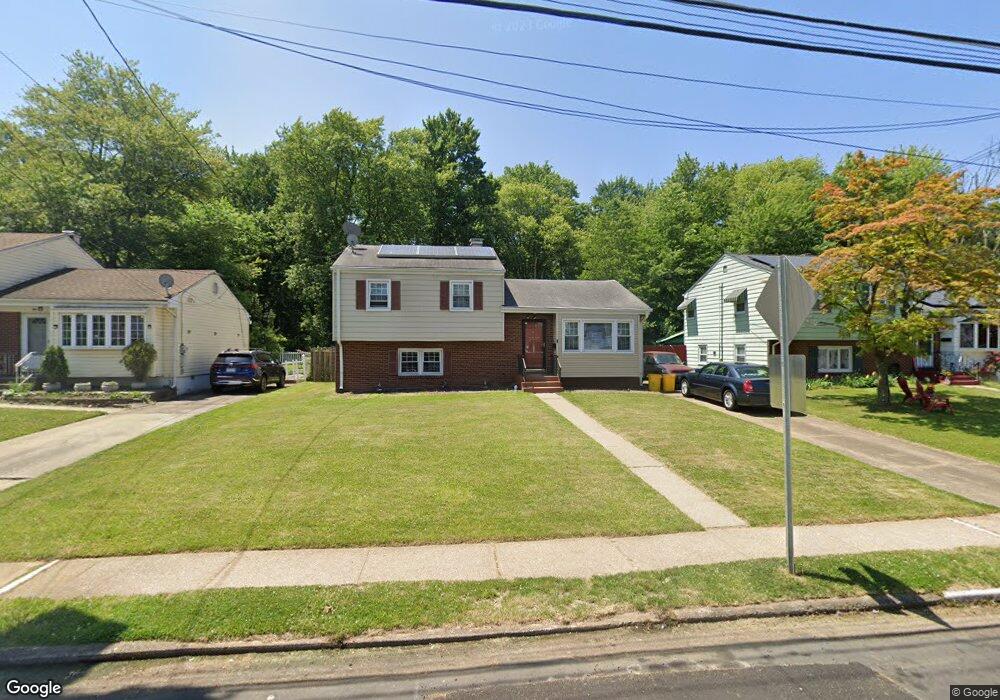
This home is located at 17 Dixmont Ave, Ewing, NJ 08618 and is currently estimated at $385,069, approximately $240 per square foot. 17 Dixmont Ave is a home located in Mercer County with nearby schools including Ewing High School, The Village Charter School, and Trenton Stem-To-Civics Charter School.
Ownership History
Date
Name
Owned For
Owner Type
Purchase Details
Closed on
Aug 7, 1998
Sold by
Finn Jeffrey
Bought by
Neely Charles and Terry Barbara
Current Estimated Value
Home Financials for this Owner
Home Financials are based on the most recent Mortgage that was taken out on this home.
Original Mortgage
$107,910
Outstanding Balance
$22,473
Interest Rate
6.9%
Estimated Equity
$362,596
Purchase Details
Closed on
Oct 13, 1995
Sold by
Sansone Robert
Bought by
Finn Jeffrey and Finn Heather
Home Financials for this Owner
Home Financials are based on the most recent Mortgage that was taken out on this home.
Original Mortgage
$117,000
Interest Rate
7.71%
Purchase Details
Closed on
Aug 21, 1989
Sold by
Glinz Linda C
Bought by
Sansone Robert B and Sansone Lisa C
Create a Home Valuation Report for This Property
The Home Valuation Report is an in-depth analysis detailing your home's value as well as a comparison with similar homes in the area
Home Values in the Area
Average Home Value in this Area
Purchase History
| Date | Buyer | Sale Price | Title Company |
|---|---|---|---|
| Neely Charles | $119,900 | -- | |
| Finn Jeffrey | $122,900 | -- | |
| Sansone Robert B | $108,000 | -- |
Source: Public Records
Mortgage History
| Date | Status | Borrower | Loan Amount |
|---|---|---|---|
| Open | Neely Charles | $107,910 | |
| Previous Owner | Finn Jeffrey | $117,000 |
Source: Public Records
Tax History
| Year | Tax Paid | Tax Assessment Tax Assessment Total Assessment is a certain percentage of the fair market value that is determined by local assessors to be the total taxable value of land and additions on the property. | Land | Improvement |
|---|---|---|---|---|
| 2025 | $7,422 | $188,700 | $64,200 | $124,500 |
| 2024 | $6,976 | $188,700 | $64,200 | $124,500 |
Source: Public Records
Map
Nearby Homes
- 21 Dixmont Ave
- 1060 Terrace Blvd
- 33 Stratford Ave
- 288 Clamer Rd
- 126 Rutledge Ave
- 41 Harding St
- 409 Silvia St
- 1200 Silvia St
- 152 Franklyn Rd
- 322 Wynnewood Rd
- 71 Carlton Ave
- 860 Lower Ferry Rd Unit 5P
- 860 Lower Ferry Rd Unit 2K
- 20 Steinway Ave
- 107 Kyle Way
- 18 Kyle Way
- 121 Kyle Way
- 59 Kyle Way
- 37 van Duyn Dr
- 51 van Duyn Dr
Your Personal Tour Guide
Ask me questions while you tour the home.