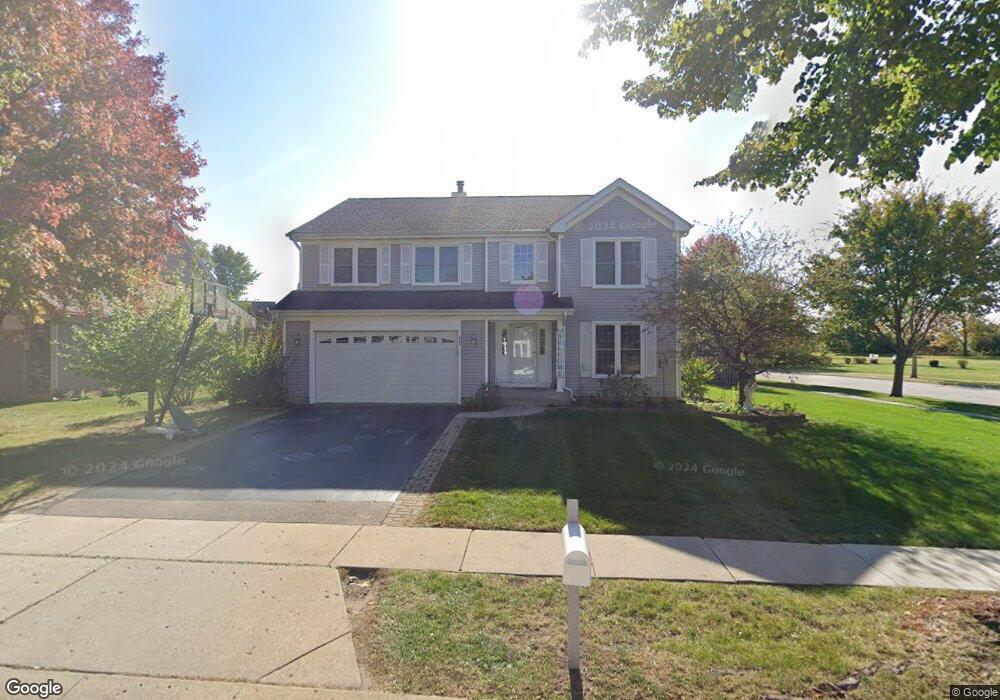
17 Driftwood Ct Algonquin, IL 60102
Estimated Value: $443,115 - $500,000
4
Beds
--
Bath
2,600
Sq Ft
$182/Sq Ft
Est. Value
About This Home
This home is located at 17 Driftwood Ct, Algonquin, IL 60102 and is currently estimated at $473,279, approximately $182 per square foot. 17 Driftwood Ct is a home located in Kane County with nearby schools including Westfield Community School and Harry D Jacobs High School.
Ownership History
Date
Name
Owned For
Owner Type
Purchase Details
Closed on
Dec 28, 2015
Sold by
Frierdich Bruce E
Bought by
Frierdich Bruce E and Bernardi Frierdich Nancy
Current Estimated Value
Purchase Details
Closed on
Aug 12, 2003
Sold by
Hahn Paul J and Hahn Marian R
Bought by
Frierdich Bruce E
Home Financials for this Owner
Home Financials are based on the most recent Mortgage that was taken out on this home.
Original Mortgage
$287,500
Interest Rate
8%
Mortgage Type
Purchase Money Mortgage
Purchase Details
Closed on
Nov 30, 1994
Sold by
Willoughby Farms First Ltd Partnership
Bought by
Hahn Paul J and Hahn Marian R
Home Financials for this Owner
Home Financials are based on the most recent Mortgage that was taken out on this home.
Original Mortgage
$150,000
Interest Rate
9.06%
Create a Home Valuation Report for This Property
The Home Valuation Report is an in-depth analysis detailing your home's value as well as a comparison with similar homes in the area
Home Values in the Area
Average Home Value in this Area
Purchase History
| Date | Buyer | Sale Price | Title Company |
|---|---|---|---|
| Frierdich Bruce E | -- | Attorney | |
| Frierdich Bruce E | $287,500 | Stewart Title Guaranty Compa | |
| Hahn Paul J | $205,000 | Chicago Title Insurance Co |
Source: Public Records
Mortgage History
| Date | Status | Borrower | Loan Amount |
|---|---|---|---|
| Previous Owner | Frierdich Bruce E | $287,500 | |
| Previous Owner | Hahn Paul J | $150,000 |
Source: Public Records
Tax History Compared to Growth
Tax History
| Year | Tax Paid | Tax Assessment Tax Assessment Total Assessment is a certain percentage of the fair market value that is determined by local assessors to be the total taxable value of land and additions on the property. | Land | Improvement |
|---|---|---|---|---|
| 2024 | $9,657 | $135,011 | $26,492 | $108,519 |
| 2023 | $9,236 | $121,479 | $23,837 | $97,642 |
| 2022 | $9,304 | $117,329 | $23,837 | $93,492 |
| 2021 | $9,035 | $110,782 | $22,507 | $88,275 |
| 2020 | $8,862 | $108,291 | $22,001 | $86,290 |
| 2019 | $8,595 | $102,802 | $20,886 | $81,916 |
| 2018 | $8,738 | $100,766 | $20,472 | $80,294 |
| 2017 | $8,391 | $94,262 | $19,151 | $75,111 |
| 2016 | $8,179 | $87,002 | $18,543 | $68,459 |
| 2015 | -- | $78,784 | $17,040 | $61,744 |
| 2014 | -- | $74,901 | $16,569 | $58,332 |
| 2013 | -- | $77,193 | $17,076 | $60,117 |
Source: Public Records
Map
Nearby Homes
- 30 Arbordale Ct Unit 4284
- 2101 Peach Tree Ln Unit 4094
- 1900 Waverly Ln
- 1971 Peach Tree Ln
- 2043 Peach Tree Ln Unit 4122
- 000 County Line Rd
- 2161 Burnham Ct
- Marianne Plan at Algonquin Meadows - Traditional Townhomes
- Darcy Plan at Algonquin Meadows - Traditional Townhomes
- Charlotte Plan at Algonquin Meadows - Traditional Townhomes
- 2060 Dorchester Ave
- Adams Plan at Algonquin Meadows - Single Family
- Sequoia Plan at Algonquin Meadows - Single Family
- Bryce Plan at Algonquin Meadows - Single Family
- Rainier Plan at Algonquin Meadows - Single Family
- Santa Rosa Plan at Algonquin Meadows - Single Family
- Biscayne Plan at Algonquin Meadows - Single Family
- Amherst Plan at Algonquin Meadows - Urban Townhomes
- Chatham Plan at Algonquin Meadows - Urban Townhomes
- Chelsea Plan at Algonquin Meadows - Urban Townhomes
- 15 Driftwood Ct Unit 6
- 13 Driftwood Ct
- 1850 Arbordale Ln
- 1840 Arbordale Ln
- 1 Driftwood Ct Unit 6
- 3 Driftwood Ct
- 1830 Arbordale Ln
- 11 Driftwood Ct
- 2130 Peach Tree Ln Unit 4256
- 2140 Peach Tree Ln
- 5 Driftwood Ct
- 6 Arbordale Ct Unit 4264
- 12 Arbordale Ct Unit 4261
- 4 Arbordale Ct Unit 4265
- 10 Arbordale Ct Unit 4262
- 8 Arbordale Ct Unit 4263
- 4 Arbordale Ct Unit 4
- 2 Arbordale Ct Unit 4266
- 1820 Arbordale Ln
- 9 Driftwood Ct Unit 6