Estimated Value: $191,503 - $259,000
Studio
--
Bath
1,395
Sq Ft
$171/Sq Ft
Est. Value
About This Home
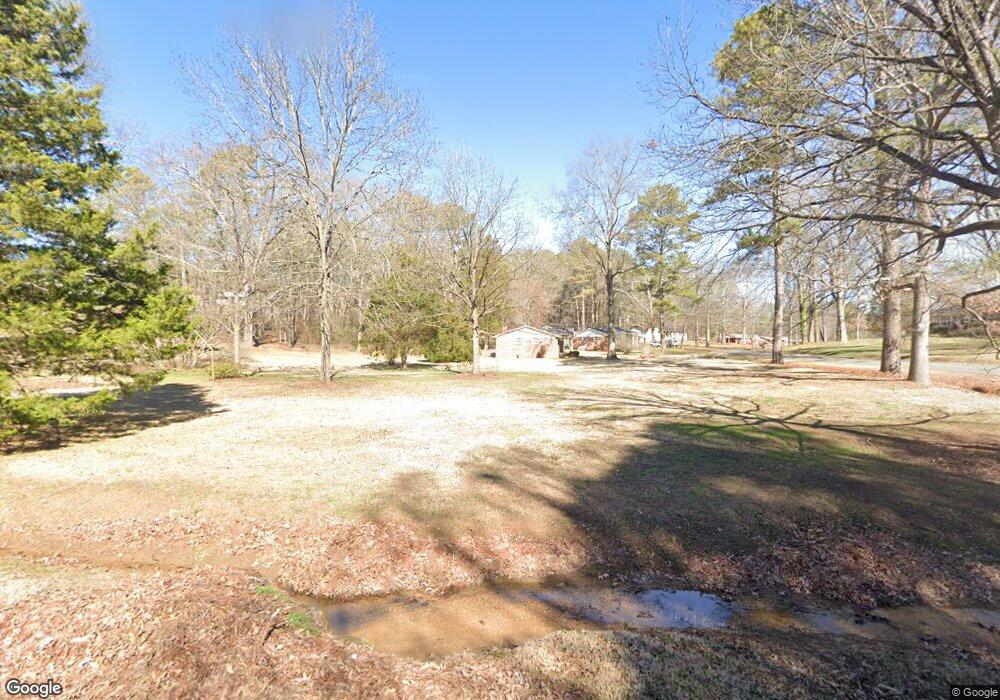
This home is located at 17 E Camelia Rd NE, Rome, GA 30161 and is currently estimated at $238,626, approximately $171 per square foot. 17 E Camelia Rd NE is a home located in Floyd County with nearby schools including Model Middle School and Model High School.
Ownership History
Date
Name
Owned For
Owner Type
Purchase Details
Closed on
Aug 2, 2016
Sold by
Rudeseal Vivian W
Bought by
Rudeseal Vivian W and Rudeseal Bret E
Current Estimated Value
Purchase Details
Closed on
May 6, 2016
Sold by
Eugene Isaac
Bought by
Rudeseal Vivian W
Purchase Details
Closed on
Mar 3, 2016
Sold by
Rudeseal Isaace E Estate & Vivian W Rude
Bought by
Rudeseal Vivian W
Purchase Details
Closed on
Oct 11, 2015
Sold by
Rudeseal Isaac E and Rudeseal Vivian W
Bought by
Rudeseal Isaac E Estate & Vivian W Rude
Purchase Details
Closed on
May 28, 1987
Sold by
Hamilton Michael Charles
Bought by
Rudeseal Isaac E and Rudeseal Vivian W
Purchase Details
Closed on
Dec 21, 1978
Sold by
Barrett Earl N and Virginia Louise Int
Bought by
Hamilton Michael Charles
Purchase Details
Closed on
Oct 1, 1967
Bought by
P and R
Purchase Details
Closed on
Aug 28, 1967
Sold by
Hall John Wayne
Bought by
Barrett Earl N and Virginia Louise 1
Purchase Details
Closed on
May 22, 1963
Bought by
Hall John Wayne
Create a Home Valuation Report for This Property
The Home Valuation Report is an in-depth analysis detailing your home's value as well as a comparison with similar homes in the area
Home Values in the Area
Average Home Value in this Area
Purchase History
| Date | Buyer | Sale Price | Title Company |
|---|---|---|---|
| Rudeseal Vivian W | -- | -- | |
| Rudeseal Vivian W | -- | -- | |
| Rudeseal Vivian W | -- | -- | |
| Rudeseal Isaac E Estate & Vivian W Rude | -- | -- | |
| Rudeseal Isaac E | -- | -- | |
| Hamilton Michael Charles | $35,000 | -- | |
| P | -- | -- | |
| Barrett Earl N | $18,500 | -- | |
| Hall John Wayne | -- | -- |
Source: Public Records
Tax History
| Year | Tax Paid | Tax Assessment Tax Assessment Total Assessment is a certain percentage of the fair market value that is determined by local assessors to be the total taxable value of land and additions on the property. | Land | Improvement |
|---|---|---|---|---|
| 2025 | $705 | $61,761 | $24,934 | $36,827 |
| 2024 | $705 | $59,228 | $22,667 | $36,561 |
| 2023 | $639 | $56,569 | $20,148 | $36,421 |
| 2022 | $332 | $52,821 | $16,371 | $36,450 |
| 2021 | $417 | $42,019 | $15,111 | $26,908 |
| 2020 | $408 | $37,443 | $11,963 | $25,480 |
| 2019 | $397 | $36,015 | $11,963 | $24,052 |
| 2018 | $397 | $34,607 | $11,963 | $22,644 |
| 2017 | $397 | $33,750 | $11,963 | $21,787 |
| 2016 | $0 | $33,160 | $11,960 | $21,200 |
| 2015 | $303 | $33,160 | $11,960 | $21,200 |
| 2014 | $303 | $33,160 | $11,960 | $21,200 |
Source: Public Records
Map
Nearby Homes
- 16 Cinnamon Ln NE
- 7 Thrushwood Rd NE
- 137 New Hermitage Rd NE
- 398 New Hermitage Rd NE
- 75 Old Shannon Rd NE
- 320 Old Shannon Rd NE
- 00 Todd St NE
- 810 Shannon Circle Connector NE
- 4th Shannon Cir NE
- 825 Shannon Cir NE
- 6 Keystone Ln NE
- 535 1st St NE
- 4843 Calhoun Rd NE
- 59 Round Rock Cir NE
- 489 Barron Rd NE
- 0 E Hermitage Unit 26083645
- 255 E 2nd St NE
- 430 Third St
- 140 1st St NE
- 0 Flowery Branch Rd Unit 7684237
- 17 E Camelia Rd NE
- 22 E Camelia Rd NE
- 9 Cinnamon Ln NE
- 20 E Camelia Rd NE
- 18 Camelia Ln NE
- 5 Kris Dr NE
- 3 Cinnamon Ln NE
- 3 Cinnamon Ln NE
- 9 Kris Dr NE
- 3 Kris Dr NE
- 3 Kris Dr NE
- 1 Cinnamon Ln NE
- 11 Cinnamon Ln NE
- 4 Cinnamon Ln NE
- 11 Kris Dr NE
- 11 New Hermitage Rd NE
- 23 E Camelia Rd NE
- 28 E Camelia Rd NE
- 10 Skyline Dr NE
- 12 Skyline Dr NE
Your Personal Tour Guide
Ask me questions while you tour the home.