
Landlord's Agent in 2014
Kevin Murphy
Main Line Executive Realty
(610) 348-1571
5 in this area
29 Total Sales
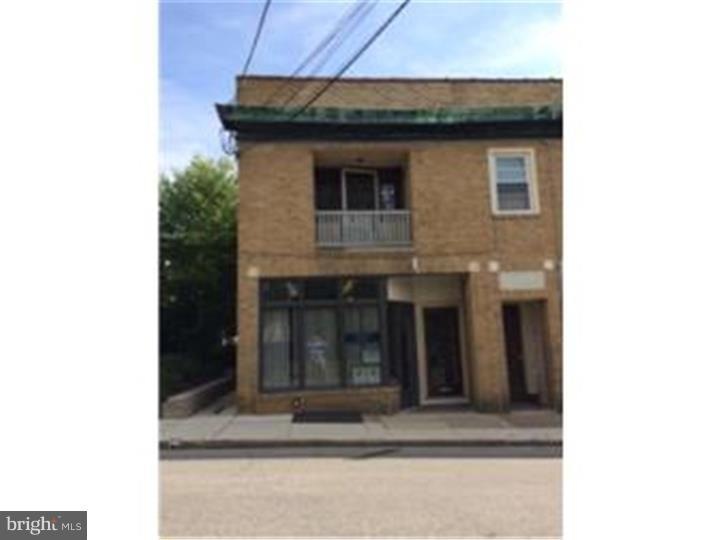
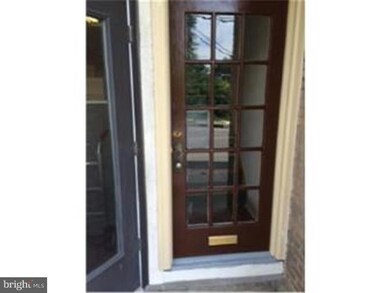
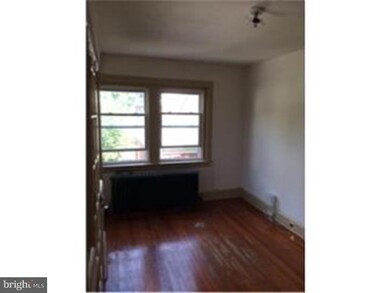
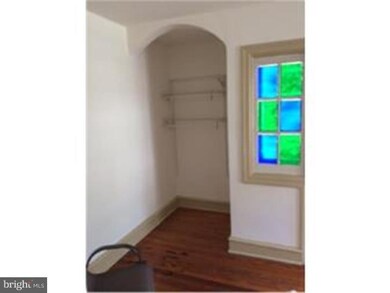
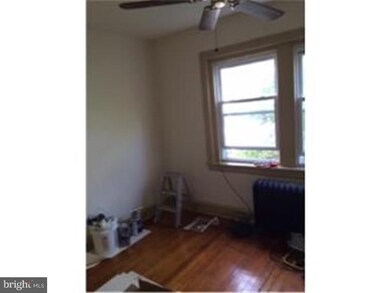
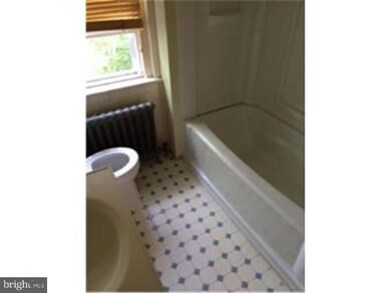
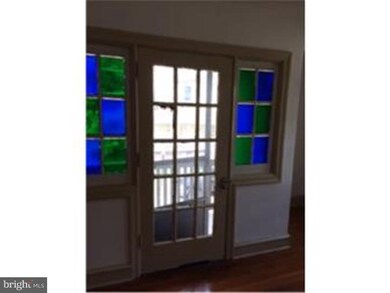
This spacious two bedroom apartment in Ardmore is in Lower Merion Township School District and near to everything. The playground, pool, shopping, transportation and restaurants are just a few blocks away. This unit is still being upgraded at this time. Hardwood floors throughout the unit, front balcony, lots of space inside. Freshly painted, this unit shows well. Must see as this opportunity will not last long.
Last Agent to Rent the Property
(610) 658-2920 mainlineexecutive@gmail.com Main Line Executive Realty License #RM422225 Listed on: 08/11/2014
Last Renter's Agent
(610) 658-2920 mainlineexecutive@gmail.com Main Line Executive Realty License #RM422225 Listed on: 08/11/2014
| Date | Event | Price | List to Sale | Price per Sq Ft |
|---|---|---|---|---|
| 08/22/2014 08/22/14 | Rented | $985 | 0.0% | -- |
| 08/21/2014 08/21/14 | Under Contract | -- | -- | -- |
| 08/11/2014 08/11/14 | For Rent | $985 | -- | -- |
| Year | Tax Paid | Tax Assessment Tax Assessment Total Assessment is a certain percentage of the fair market value that is determined by local assessors to be the total taxable value of land and additions on the property. | Land | Improvement |
|---|---|---|---|---|
| 2025 | $4,325 | $103,570 | $25,840 | $77,730 |
| 2024 | $4,325 | $103,570 | $25,840 | $77,730 |
| 2023 | $4,145 | $103,570 | $25,840 | $77,730 |
| 2022 | $4,068 | $103,570 | $25,840 | $77,730 |
| 2021 | $3,976 | $103,570 | $25,840 | $77,730 |
| 2020 | $3,878 | $103,570 | $25,840 | $77,730 |
| 2019 | $3,810 | $103,570 | $25,840 | $77,730 |
Landlord's Agent in 2014
Kevin Murphy
Main Line Executive Realty
(610) 348-1571
5 in this area
29 Total Sales
Source: Bright MLS
MLS Number: 1003042104
APN: 40-00-55816-007
Disclaimer: Certain information contained herein is derived from information provided by parties other than Homes.com. All information provided is deemed reliable, but is not guaranteed to be accurate and should be independently verified.
![]() The data relating to real estate for sale on this website appears in part through the BRIGHT Internet Data Exchange program, a voluntary cooperative exchange of property listing data between licensed real estate brokerage firms, and is provided by BRIGHT through a licensing agreement.
The data relating to real estate for sale on this website appears in part through the BRIGHT Internet Data Exchange program, a voluntary cooperative exchange of property listing data between licensed real estate brokerage firms, and is provided by BRIGHT through a licensing agreement.
Listing information is from various brokers who participate in the Bright MLS IDX program and not all listings may be visible on the site.
The property information being provided on or through the website is for the personal, non-commercial use of consumers and such information may not be used for any purpose other than to identify prospective properties consumers may be interested in purchasing.
Some properties which appear for sale on the website may no longer be available because they are for instance, under contract, sold or are no longer being offered for sale.
Property information displayed is deemed reliable but is not guaranteed.
Copyright 2026 Bright MLS, Inc.
Ask me questions while you tour the home.