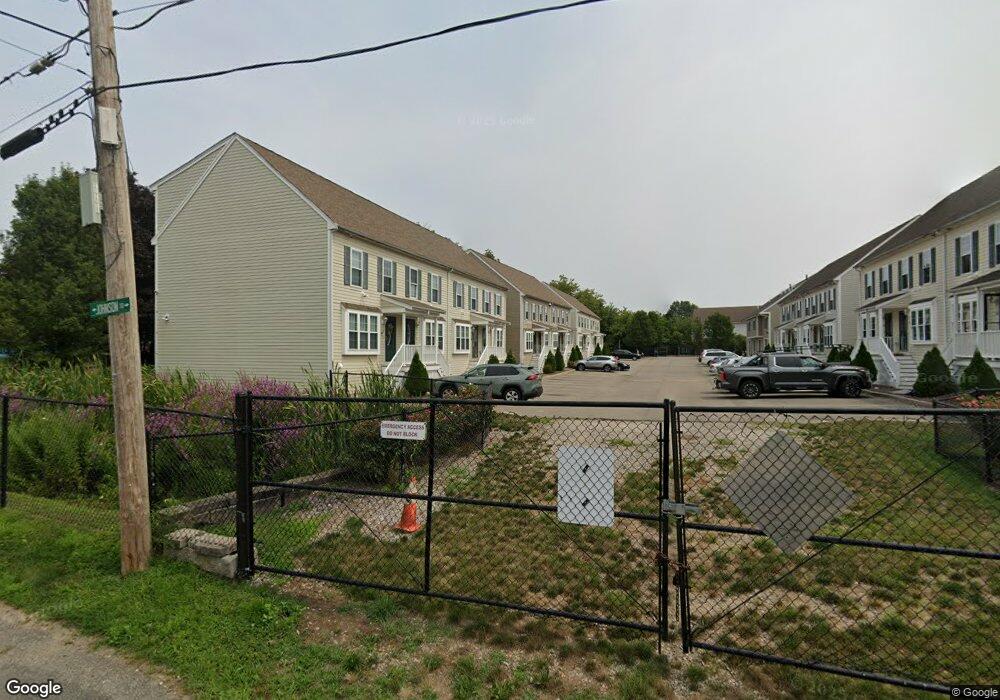
17 Foster St Unit 26 Brockton, MA 02301
Clifton Heights NeighborhoodEstimated Value: $355,352 - $380,000
2
Beds
2
Baths
990
Sq Ft
$377/Sq Ft
Est. Value
About This Home
This home is located at 17 Foster St Unit 26, Brockton, MA 02301 and is currently estimated at $373,338, approximately $377 per square foot. 17 Foster St Unit 26 is a home located in Plymouth County with nearby schools including Arnone Elementary School, Joseph F. Plouffe Middle School, and Trinity Catholic Academy.
Ownership History
Date
Name
Owned For
Owner Type
Purchase Details
Closed on
Oct 1, 2013
Sold by
Nsp Residential Llc
Bought by
Jones-Booker Jonandria C and Jones-Booker Anthony T
Current Estimated Value
Home Financials for this Owner
Home Financials are based on the most recent Mortgage that was taken out on this home.
Original Mortgage
$90,000
Outstanding Balance
$67,010
Interest Rate
4.42%
Mortgage Type
New Conventional
Estimated Equity
$306,328
Purchase Details
Closed on
Aug 28, 2013
Sold by
Jones-Booker Anthony T and Jones-Booker Jonandria C
Bought by
Nsp Residential Llc
Home Financials for this Owner
Home Financials are based on the most recent Mortgage that was taken out on this home.
Original Mortgage
$90,000
Outstanding Balance
$67,010
Interest Rate
4.42%
Mortgage Type
New Conventional
Estimated Equity
$306,328
Purchase Details
Closed on
Sep 18, 2007
Sold by
Johnson Square Bldrs L
Bought by
Jones-Booker Anthony T and Jones-Booker Jonandria C
Home Financials for this Owner
Home Financials are based on the most recent Mortgage that was taken out on this home.
Original Mortgage
$209,500
Interest Rate
6.7%
Mortgage Type
Purchase Money Mortgage
Create a Home Valuation Report for This Property
The Home Valuation Report is an in-depth analysis detailing your home's value as well as a comparison with similar homes in the area
Home Values in the Area
Average Home Value in this Area
Purchase History
| Date | Buyer | Sale Price | Title Company |
|---|---|---|---|
| Jones-Booker Jonandria C | $90,000 | -- | |
| Nsp Residential Llc | $67,000 | -- | |
| Jones-Booker Anthony T | $209,500 | -- |
Source: Public Records
Mortgage History
| Date | Status | Borrower | Loan Amount |
|---|---|---|---|
| Open | Jones-Booker Jonandria C | $90,000 | |
| Closed | Jones-Booker Jonandria C | $90,000 | |
| Previous Owner | Jones-Booker Anthony T | $209,500 |
Source: Public Records
Tax History Compared to Growth
Tax History
| Year | Tax Paid | Tax Assessment Tax Assessment Total Assessment is a certain percentage of the fair market value that is determined by local assessors to be the total taxable value of land and additions on the property. | Land | Improvement |
|---|---|---|---|---|
| 2025 | $3,587 | $296,200 | $0 | $296,200 |
| 2024 | $3,001 | $249,700 | $0 | $249,700 |
| 2023 | $3,092 | $238,200 | $0 | $238,200 |
| 2022 | $2,841 | $203,400 | $0 | $203,400 |
| 2021 | $2,841 | $195,900 | $0 | $195,900 |
| 2020 | $2,744 | $181,100 | $0 | $181,100 |
| 2019 | $2,499 | $160,800 | $0 | $160,800 |
| 2018 | $2,089 | $130,100 | $0 | $130,100 |
| 2017 | $1,977 | $122,800 | $0 | $122,800 |
| 2016 | $2,005 | $115,470 | $0 | $115,470 |
| 2015 | $1,792 | $98,720 | $0 | $98,720 |
| 2014 | $1,850 | $102,030 | $0 | $102,030 |
Source: Public Records
Map
Nearby Homes
- 17 Foster St Unit 23
- 17 Foster St Unit 25
- 17 Foster St Unit 22
- 17 Foster St Unit 13
- 17 Foster St Unit 7
- 17 Foster St Unit 19
- 17 Foster St Unit 10
- 17 Foster St Unit 9
- 17 Foster St Unit 5
- 17 Foster St Unit 6
- 17 Foster St Unit 8
- 17 Foster St Unit 24
- 23 Foster St Unit 2
- 29 Foster St
- 35 Foster St
- 78 Dover St
- 82 Dover St
- 37 Foster St
- 66 Dover St
- 90 Dover St