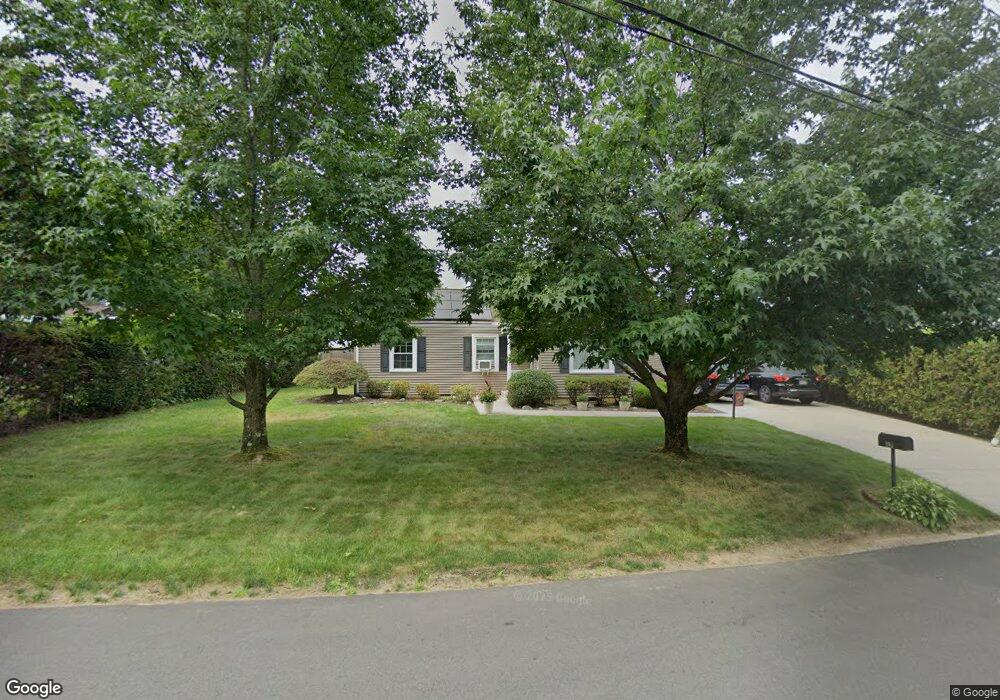
17 Grimard St Ludlow, MA 01056
Estimated Value: $289,876 - $331,000
3
Beds
2
Baths
1,094
Sq Ft
$280/Sq Ft
Est. Value
About This Home
This home is located at 17 Grimard St, Ludlow, MA 01056 and is currently estimated at $306,719, approximately $280 per square foot. 17 Grimard St is a home located in Hampden County with nearby schools including East Street Elementary School, Chapin Street Elementary School, and Paul R. Baird Middle School.
Ownership History
Date
Name
Owned For
Owner Type
Purchase Details
Closed on
Mar 14, 2003
Sold by
Kusek Sandra L
Bought by
Goodwin Daniel M and Goodwin Sarah M
Current Estimated Value
Home Financials for this Owner
Home Financials are based on the most recent Mortgage that was taken out on this home.
Original Mortgage
$128,000
Outstanding Balance
$53,794
Interest Rate
5.94%
Mortgage Type
Purchase Money Mortgage
Estimated Equity
$252,925
Create a Home Valuation Report for This Property
The Home Valuation Report is an in-depth analysis detailing your home's value as well as a comparison with similar homes in the area
Home Values in the Area
Average Home Value in this Area
Purchase History
| Date | Buyer | Sale Price | Title Company |
|---|---|---|---|
| Goodwin Daniel M | $135,000 | -- | |
| Goodwin Daniel M | $135,000 | -- |
Source: Public Records
Mortgage History
| Date | Status | Borrower | Loan Amount |
|---|---|---|---|
| Open | Goodwin Daniel M | $128,000 | |
| Closed | Goodwin Daniel M | $128,000 |
Source: Public Records
Tax History
| Year | Tax Paid | Tax Assessment Tax Assessment Total Assessment is a certain percentage of the fair market value that is determined by local assessors to be the total taxable value of land and additions on the property. | Land | Improvement |
|---|---|---|---|---|
| 2025 | $3,992 | $230,100 | $75,000 | $155,100 |
| 2024 | $3,831 | $211,800 | $74,900 | $136,900 |
| 2023 | $3,603 | $184,700 | $65,700 | $119,000 |
| 2022 | $3,454 | $172,800 | $65,700 | $107,100 |
| 2021 | $3,480 | $165,100 | $65,700 | $99,400 |
| 2020 | $3,336 | $161,800 | $64,700 | $97,100 |
| 2019 | $3,092 | $156,000 | $64,100 | $91,900 |
| 2018 | $2,905 | $152,800 | $64,100 | $88,700 |
| 2017 | $2,804 | $151,300 | $62,200 | $89,100 |
| 2016 | $2,667 | $147,100 | $61,000 | $86,100 |
| 2015 | $2,528 | $146,200 | $60,300 | $85,900 |
Source: Public Records
Map
Nearby Homes
- 42 Roy St
- Lot 602 Grandview Ave
- 59 Prospect Gardens
- 15 Hilltop Terrace
- 12 Mariana Ln
- 208 West St
- 166-168 Main St
- 201 Main St
- 1045-1047 Worcester St
- 365 Water St Unit 367
- 57 Belmont St
- 115 Hampden St
- 295 Main St
- 54 Old Fuller rd Extension
- 0 N S Main St Io
- 382 Holyoke St
- 28 Mockingbird Dr
- 189 Essex St Unit H
- 96 Lyons St
- 46-48 Milton St
Your Personal Tour Guide
Ask me questions while you tour the home.