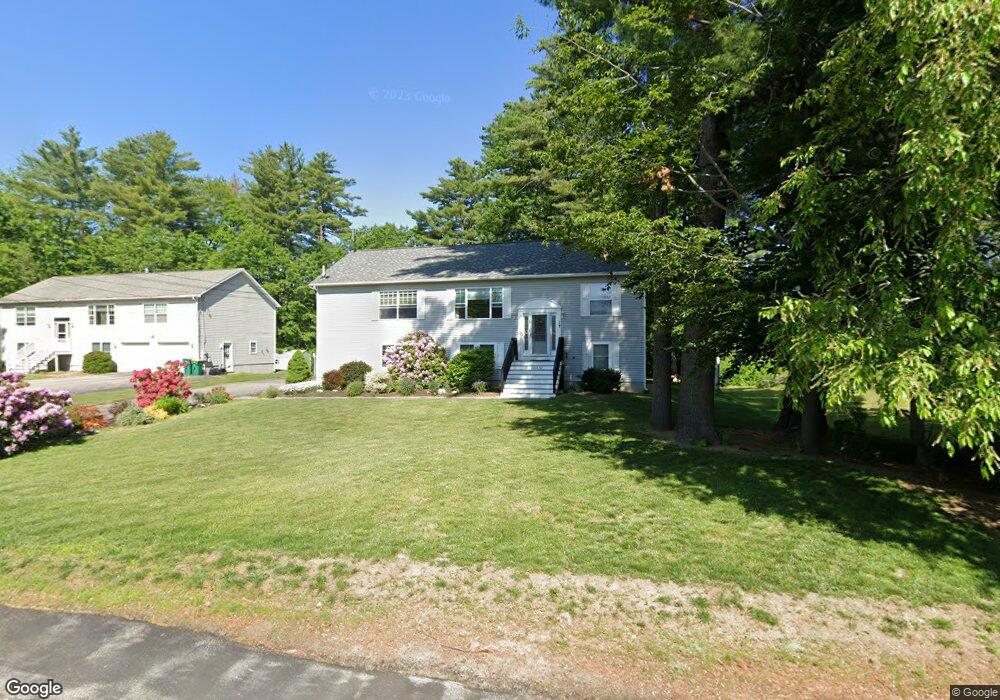
17 Hale St Rochester, NH 03867
Estimated Value: $472,236 - $490,000
3
Beds
2
Baths
1,404
Sq Ft
$342/Sq Ft
Est. Value
About This Home
This home is located at 17 Hale St, Rochester, NH 03867 and is currently estimated at $480,059, approximately $341 per square foot. 17 Hale St is a home located in Strafford County with nearby schools including Mcclelland School, Rochester Middle School, and Spaulding High School.
Ownership History
Date
Name
Owned For
Owner Type
Purchase Details
Closed on
Jun 13, 2005
Sold by
White Mt Custom Homes
Bought by
Laurion David E and Laurion Sharon
Current Estimated Value
Home Financials for this Owner
Home Financials are based on the most recent Mortgage that was taken out on this home.
Original Mortgage
$223,250
Interest Rate
5.79%
Create a Home Valuation Report for This Property
The Home Valuation Report is an in-depth analysis detailing your home's value as well as a comparison with similar homes in the area
Home Values in the Area
Average Home Value in this Area
Purchase History
| Date | Buyer | Sale Price | Title Company |
|---|---|---|---|
| Laurion David E | $245,000 | -- | |
| Laurion David E | $245,000 | -- |
Source: Public Records
Mortgage History
| Date | Status | Borrower | Loan Amount |
|---|---|---|---|
| Open | Laurion David E | $201,000 | |
| Closed | Laurion David E | $223,250 |
Source: Public Records
Tax History Compared to Growth
Tax History
| Year | Tax Paid | Tax Assessment Tax Assessment Total Assessment is a certain percentage of the fair market value that is determined by local assessors to be the total taxable value of land and additions on the property. | Land | Improvement |
|---|---|---|---|---|
| 2024 | $7,279 | $490,200 | $109,500 | $380,700 |
| 2023 | $6,847 | $266,000 | $54,600 | $211,400 |
| 2022 | $6,724 | $266,000 | $54,600 | $211,400 |
| 2021 | $6,557 | $266,000 | $54,600 | $211,400 |
| 2020 | $6,566 | $266,800 | $54,600 | $212,200 |
| 2019 | $6,643 | $266,800 | $54,600 | $212,200 |
| 2018 | $7,276 | $264,400 | $38,300 | $226,100 |
| 2017 | $6,962 | $264,400 | $38,300 | $226,100 |
| 2016 | $6,531 | $231,100 | $38,300 | $192,800 |
| 2015 | $6,505 | $231,100 | $38,300 | $192,800 |
| 2014 | $6,348 | $231,100 | $38,300 | $192,800 |
| 2013 | $5,493 | $208,400 | $51,000 | $157,400 |
| 2012 | $5,352 | $208,400 | $51,000 | $157,400 |
Source: Public Records
Map
Nearby Homes
- 2 Hale St
- 81 Washington St
- 51 Chestnut St
- 0 Washington St
- 31 Brock St
- 161 N Main St
- 16 Springfield Ct
- 168 Brock St
- 57 Congress St
- 86 Wakefield St
- 13 Miami Way Unit B
- 47 Hanson St
- 45 Hanson St
- 2 Cape Coral Way Unit A
- 2 Cape Coral Way Unit B
- 142 Brock St
- 8 Perimeter Dr
- 17 Winter St
- 164 Brock St
- 7 Mcintire Ct