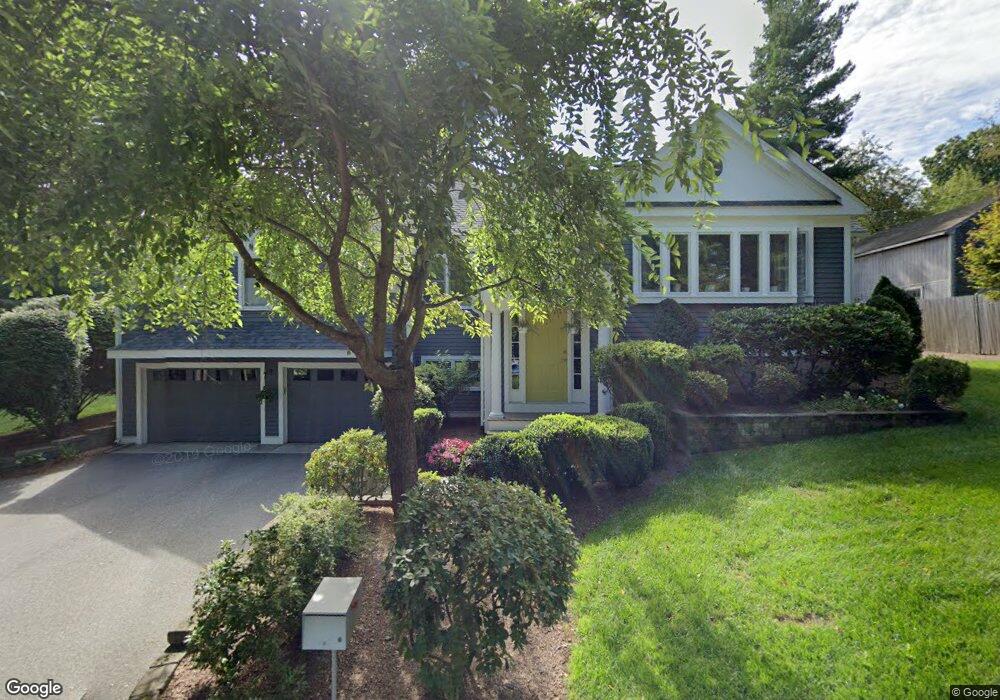
17 Harding St Sharon, MA 02067
Estimated Value: $773,841 - $1,045,000
3
Beds
3
Baths
2,241
Sq Ft
$405/Sq Ft
Est. Value
About This Home
This home is located at 17 Harding St, Sharon, MA 02067 and is currently estimated at $906,710, approximately $404 per square foot. 17 Harding St is a home located in Norfolk County with nearby schools including Heights Elementary School, Sharon Middle School, and Sharon High School.
Ownership History
Date
Name
Owned For
Owner Type
Purchase Details
Closed on
Dec 10, 2008
Sold by
Anderson Dana W and Vail Joanne
Bought by
Wrona Iwona and Giguere Joshua
Current Estimated Value
Home Financials for this Owner
Home Financials are based on the most recent Mortgage that was taken out on this home.
Original Mortgage
$464,977
Outstanding Balance
$312,586
Interest Rate
6.49%
Mortgage Type
Purchase Money Mortgage
Estimated Equity
$594,124
Purchase Details
Closed on
Aug 10, 1994
Sold by
Nally Judson C and Nally Jacquelyn M
Bought by
Vail Jo-Anne
Purchase Details
Closed on
Sep 21, 1987
Sold by
Chambers John G
Bought by
Nally Judson C
Create a Home Valuation Report for This Property
The Home Valuation Report is an in-depth analysis detailing your home's value as well as a comparison with similar homes in the area
Home Values in the Area
Average Home Value in this Area
Purchase History
| Date | Buyer | Sale Price | Title Company |
|---|---|---|---|
| Wrona Iwona | $467,500 | -- | |
| Vail Jo-Anne | $126,500 | -- | |
| Nally Judson C | $130,000 | -- |
Source: Public Records
Mortgage History
| Date | Status | Borrower | Loan Amount |
|---|---|---|---|
| Open | Wrona Iwona | $464,977 | |
| Previous Owner | Nally Judson C | $275,000 |
Source: Public Records
Tax History
| Year | Tax Paid | Tax Assessment Tax Assessment Total Assessment is a certain percentage of the fair market value that is determined by local assessors to be the total taxable value of land and additions on the property. | Land | Improvement |
|---|---|---|---|---|
| 2025 | $10,881 | $622,500 | $339,400 | $283,100 |
| 2024 | $10,219 | $581,300 | $311,400 | $269,900 |
| 2023 | $10,011 | $538,500 | $291,000 | $247,500 |
| 2022 | $9,456 | $478,800 | $242,500 | $236,300 |
| 2021 | $9,214 | $451,000 | $221,400 | $229,600 |
| 2020 | $8,428 | $443,600 | $214,000 | $229,600 |
| 2019 | $8,302 | $427,700 | $198,100 | $229,600 |
| 2018 | $8,209 | $423,800 | $194,200 | $229,600 |
| 2017 | $7,664 | $390,600 | $181,500 | $209,100 |
| 2016 | $7,485 | $372,200 | $181,500 | $190,700 |
| 2015 | $6,997 | $344,700 | $166,500 | $178,200 |
| 2014 | $6,529 | $317,700 | $151,400 | $166,300 |
Source: Public Records
Map
Nearby Homes
Your Personal Tour Guide
Ask me questions while you tour the home.