
Seller's Agent in 2026
Lisa Bailey
RE/MAX
(603) 860-6116
1 in this area
104 Total Sales
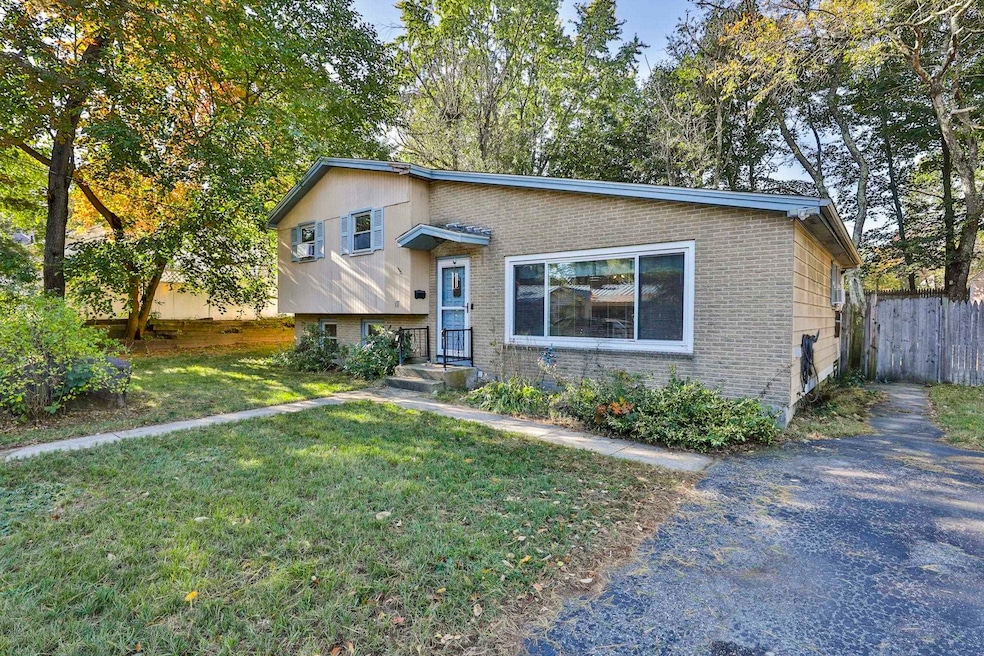

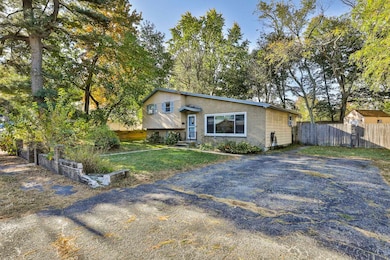
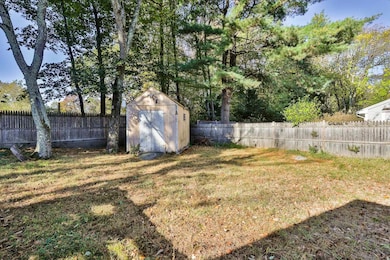
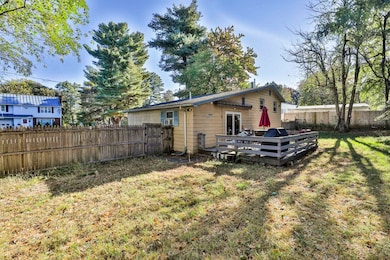
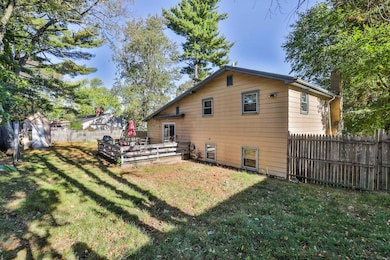
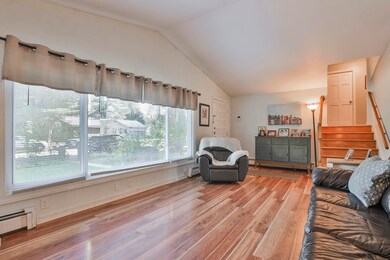
This distinctive tri-level home stands out with its character and open-concept design. The updated kitchen opens seamlessly to the dining and living areas, perfect for entertaining or everyday living. Upstairs, you’ll find two comfortable bedrooms and a full bath. The lower level offers additional flexible space and a convenient half bath. Step outside to enjoy a fenced yard and back deck, ideal for relaxing or hosting gatherings. Located in one of Nashua’s most desirable areas, this home offers both style and convenience close to local amenities, schools, and commuting routes. Seller intends to review offers on Thursday 10/16.
Last Agent to Sell the Property
RE/MAX Synergy Brokerage Phone: 603-860-6116 License #066208 Listed on: 10/11/2025
Last Buyer's Agent
RE/MAX Synergy Brokerage Phone: 603-860-6116 License #066208 Listed on: 10/11/2025
| Date | Type | Sale Price | Title Company |
|---|---|---|---|
| Deed | $237,000 | -- | |
| Deed | $100,000 | -- |
| Date | Status | Loan Amount | Loan Type |
|---|---|---|---|
| Open | $237,840 | Unknown | |
| Closed | $225,150 | Purchase Money Mortgage | |
| Previous Owner | $120,000 | Unknown | |
| Previous Owner | $80,000 | Unknown |
| Date | Event | Price | List to Sale | Price per Sq Ft |
|---|---|---|---|---|
| 02/27/2026 02/27/26 | Sold | $428,000 | 0.0% | $379 / Sq Ft |
| 02/06/2026 02/06/26 | Off Market | $428,000 | -- | -- |
| 02/05/2026 02/05/26 | For Sale | $400,000 | -6.5% | $354 / Sq Ft |
| 02/03/2026 02/03/26 | Off Market | $428,000 | -- | -- |
| 10/17/2025 10/17/25 | Pending | -- | -- | -- |
| 10/16/2025 10/16/25 | Pending | -- | -- | -- |
| 10/11/2025 10/11/25 | For Sale | $400,000 | -- | $354 / Sq Ft |
| Year | Tax Paid | Tax Assessment Tax Assessment Total Assessment is a certain percentage of the fair market value that is determined by local assessors to be the total taxable value of land and additions on the property. | Land | Improvement |
|---|---|---|---|---|
| 2025 | $6,577 | $390,800 | $160,400 | $230,400 |
| 2024 | $6,214 | $390,800 | $160,400 | $230,400 |
| 2023 | $5,938 | $325,700 | $128,300 | $197,400 |
| 2022 | $5,885 | $325,700 | $128,300 | $197,400 |
| 2021 | $5,361 | $230,900 | $85,500 | $145,400 |
| 2020 | $5,184 | $229,300 | $85,500 | $143,800 |
| 2019 | $4,990 | $229,300 | $85,500 | $143,800 |
| 2018 | $4,863 | $229,300 | $85,500 | $143,800 |
| 2017 | $5,140 | $199,300 | $73,200 | $126,100 |
| 2016 | $4,996 | $199,300 | $73,200 | $126,100 |
| 2015 | $4,889 | $199,300 | $73,200 | $126,100 |
| 2014 | $4,762 | $198,000 | $73,200 | $124,800 |
Seller's Agent in 2026
Lisa Bailey
RE/MAX
(603) 860-6116
1 in this area
104 Total Sales
Source: PrimeMLS
MLS Number: 5065416
APN: NASH-000111-000000-000094
Disclaimer: Certain information contained herein is derived from information provided by parties other than Homes.com. All information provided is deemed reliable, but is not guaranteed to be accurate and should be independently verified.
![]() Copyright 2026 PrimeMLS, Inc. All rights reserved. This information is deemed reliable, but not guaranteed. The data relating to real estate displayed on this display comes in part from the IDX Program of PrimeMLS. The information being provided is for consumers’ personal, non-commercial use and may not be used for any purpose other than to identify prospective properties consumers may be interested in purchasing.
Copyright 2026 PrimeMLS, Inc. All rights reserved. This information is deemed reliable, but not guaranteed. The data relating to real estate displayed on this display comes in part from the IDX Program of PrimeMLS. The information being provided is for consumers’ personal, non-commercial use and may not be used for any purpose other than to identify prospective properties consumers may be interested in purchasing.
Ask me questions while you tour the home.