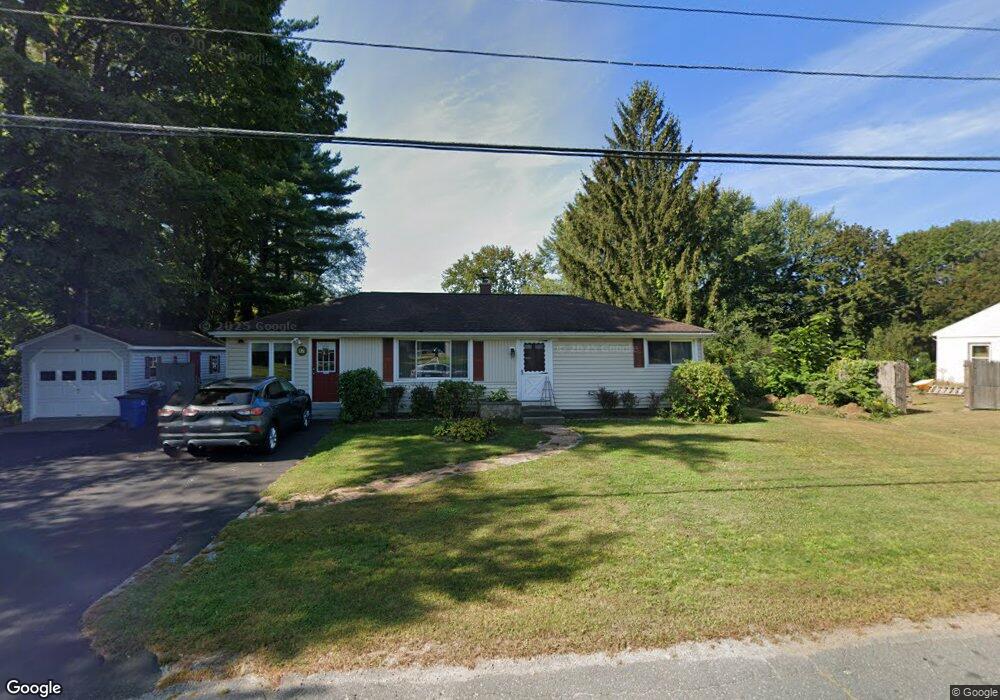
17 High St Granby, MA 01033
Estimated Value: $311,000 - $382,954
3
Beds
1
Bath
1,248
Sq Ft
$280/Sq Ft
Est. Value
About This Home
This home is located at 17 High St, Granby, MA 01033 and is currently estimated at $349,989, approximately $280 per square foot. 17 High St is a home located in Hampshire County with nearby schools including Pioneer Valley Performing Arts Charter School and Hampden Charter School of Science - East.
Ownership History
Date
Name
Owned For
Owner Type
Purchase Details
Closed on
Sep 25, 1998
Sold by
Monfette Steven E
Bought by
Piquette Paul E
Current Estimated Value
Home Financials for this Owner
Home Financials are based on the most recent Mortgage that was taken out on this home.
Original Mortgage
$43,000
Interest Rate
6.87%
Mortgage Type
Purchase Money Mortgage
Purchase Details
Closed on
Oct 15, 1997
Sold by
Monfette Roland W and Monfette Sharon L
Bought by
Monfette Steven E
Create a Home Valuation Report for This Property
The Home Valuation Report is an in-depth analysis detailing your home's value as well as a comparison with similar homes in the area
Home Values in the Area
Average Home Value in this Area
Purchase History
| Date | Buyer | Sale Price | Title Company |
|---|---|---|---|
| Piquette Paul E | $93,000 | -- | |
| Piquette Paul E | $93,000 | -- | |
| Monfette Steven E | $48,000 | -- | |
| Monfette Roland W | $4,500 | -- | |
| Monfette Steven E | $48,000 | -- |
Source: Public Records
Mortgage History
| Date | Status | Borrower | Loan Amount |
|---|---|---|---|
| Open | Monfette Steven E | $81,768 | |
| Closed | Monfette Steven E | $43,000 |
Source: Public Records
Tax History Compared to Growth
Tax History
| Year | Tax Paid | Tax Assessment Tax Assessment Total Assessment is a certain percentage of the fair market value that is determined by local assessors to be the total taxable value of land and additions on the property. | Land | Improvement |
|---|---|---|---|---|
| 2025 | $4,322 | $281,200 | $81,200 | $200,000 |
| 2024 | $4,288 | $279,700 | $77,600 | $202,100 |
| 2023 | $4,088 | $238,900 | $69,300 | $169,600 |
| 2022 | $3,970 | $208,300 | $69,300 | $139,000 |
| 2021 | $3,893 | $196,100 | $69,300 | $126,800 |
| 2020 | $3,689 | $186,600 | $67,200 | $119,400 |
| 2019 | $3,636 | $187,800 | $83,500 | $104,300 |
| 2018 | $3,556 | $178,400 | $83,500 | $94,900 |
| 2017 | $3,220 | $177,900 | $83,500 | $94,400 |
| 2016 | $3,112 | $164,900 | $77,400 | $87,500 |
| 2015 | $3,019 | $164,900 | $77,400 | $87,500 |
Source: Public Records
Map
Nearby Homes
- 200 East St
- 289 Morgan St
- 55 Pleasant St Unit 4
- 3 Miller Ave
- 586 Granby Rd
- 540 Granby Rd Unit 72A
- 540 Granby Rd Unit 109
- 540 Granby Rd Unit 62
- 540 Granby Rd Unit 2
- 2 Pine Grove Dr
- 31 College View Heights
- 73 Amherst St
- 73 Pine Grove Dr
- 121 Cold Hill Rd
- 5 Country View Ln
- 18 Smith Ave
- 5 Karen Dr
- 42 East St
- 96 College St
- 35 Yale St