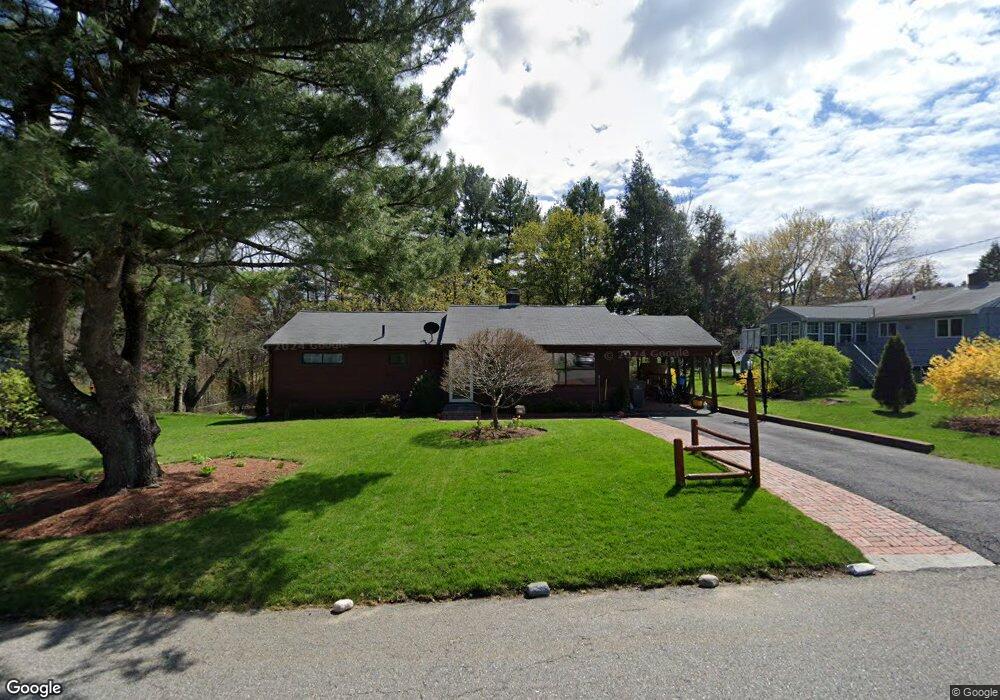
17 Hiram Rd Framingham, MA 01701
Nobscot NeighborhoodEstimated Value: $526,000 - $607,029
4
Beds
1
Bath
1,248
Sq Ft
$463/Sq Ft
Est. Value
About This Home
This home is located at 17 Hiram Rd, Framingham, MA 01701 and is currently estimated at $577,757, approximately $462 per square foot. 17 Hiram Rd is a home located in Middlesex County with nearby schools including Framingham High School, MetroWest Jewish Day School, and Sudbury Valley School.
Ownership History
Date
Name
Owned For
Owner Type
Purchase Details
Closed on
Jun 5, 2017
Sold by
Lundblad Herbert C Est and Lundblad
Bought by
Cartagena Jose O
Current Estimated Value
Home Financials for this Owner
Home Financials are based on the most recent Mortgage that was taken out on this home.
Original Mortgage
$289,000
Outstanding Balance
$240,058
Interest Rate
3.97%
Mortgage Type
New Conventional
Estimated Equity
$337,699
Create a Home Valuation Report for This Property
The Home Valuation Report is an in-depth analysis detailing your home's value as well as a comparison with similar homes in the area
Home Values in the Area
Average Home Value in this Area
Purchase History
| Date | Buyer | Sale Price | Title Company |
|---|---|---|---|
| Cartagena Jose O | $340,000 | -- | |
| Cartagena Jose O | $340,000 | -- |
Source: Public Records
Mortgage History
| Date | Status | Borrower | Loan Amount |
|---|---|---|---|
| Open | Cartagena Jose O | $289,000 | |
| Closed | Cartagena Jose O | $289,000 |
Source: Public Records
Tax History
| Year | Tax Paid | Tax Assessment Tax Assessment Total Assessment is a certain percentage of the fair market value that is determined by local assessors to be the total taxable value of land and additions on the property. | Land | Improvement |
|---|---|---|---|---|
| 2025 | $6,750 | $565,300 | $271,500 | $293,800 |
| 2024 | $6,397 | $513,400 | $242,500 | $270,900 |
| 2023 | $6,036 | $461,100 | $216,500 | $244,600 |
| 2022 | $5,725 | $416,700 | $196,400 | $220,300 |
| 2021 | $5,554 | $395,300 | $188,800 | $206,500 |
| 2020 | $5,589 | $373,100 | $171,600 | $201,500 |
| 2019 | $5,497 | $357,400 | $171,600 | $185,800 |
| 2018 | $5,395 | $330,600 | $165,200 | $165,400 |
| 2017 | $5,382 | $322,100 | $160,300 | $161,800 |
| 2016 | $5,310 | $305,500 | $160,300 | $145,200 |
| 2015 | $5,246 | $294,400 | $160,800 | $133,600 |
Source: Public Records
Map
Nearby Homes
- 106 Baldwin Ave
- 19 Nob Hill Dr
- 32 Eaton Rd W
- 301 Windsor Dr
- 907 Windsor Dr
- 2 Hemenway Rd
- 10 Rolling Ln
- 19 Rolling Ln
- 472 Potter Rd
- 44 Agnes Dr
- 4 Tartufi Cir
- 6 Mountain View Dr
- 32 Lyman Rd
- 24 Woodland Rd
- 620 Edmands Rd
- 38 Bradford Rd
- 11 Edith Rd
- 227 Water St
- 1011 Boston Post Rd
- 725 Boston Post Rd Unit 12
Your Personal Tour Guide
Ask me questions while you tour the home.