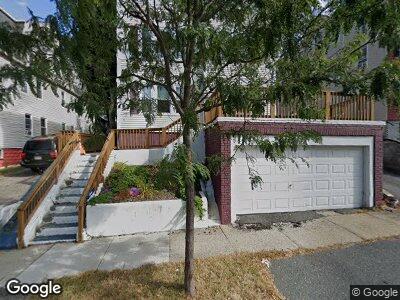
17 Hitchock Unit 3 Worcester, MA 01603
University Park NeighborhoodEstimated Value: $223,000 - $287,000
3
Beds
1
Bath
1,205
Sq Ft
$206/Sq Ft
Est. Value
About This Home
This home is located at 17 Hitchock Unit 3, Worcester, MA 01603 and is currently estimated at $248,353, approximately $206 per square foot. 17 Hitchock Unit 3 is a home located in Worcester County with nearby schools including Goddard School of Science & Technology, Jacob Hiatt Magnet School, and Chandler Magnet.
Ownership History
Date
Name
Owned For
Owner Type
Purchase Details
Closed on
Jun 12, 2015
Sold by
Shea Brian
Bought by
Quarshie Henry H
Current Estimated Value
Home Financials for this Owner
Home Financials are based on the most recent Mortgage that was taken out on this home.
Original Mortgage
$76,000
Outstanding Balance
$1,507
Interest Rate
3.65%
Mortgage Type
New Conventional
Estimated Equity
$250,963
Purchase Details
Closed on
Jun 8, 2011
Sold by
Jp Morgan Chase Bank N
Bought by
Shea Brian
Purchase Details
Closed on
Sep 16, 2010
Sold by
Fnma
Bought by
Jp Morgan Chase Bk
Purchase Details
Closed on
Oct 19, 2009
Sold by
Artey Pamela
Bought by
Federal National Mortgage Association
Purchase Details
Closed on
Jun 30, 2008
Sold by
Yeshua Jireh Llc
Bought by
Artey Pamela
Home Financials for this Owner
Home Financials are based on the most recent Mortgage that was taken out on this home.
Original Mortgage
$160,000
Interest Rate
6.07%
Mortgage Type
Purchase Money Mortgage
Create a Home Valuation Report for This Property
The Home Valuation Report is an in-depth analysis detailing your home's value as well as a comparison with similar homes in the area
Home Values in the Area
Average Home Value in this Area
Purchase History
| Date | Buyer | Sale Price | Title Company |
|---|---|---|---|
| Quarshie Henry H | $80,000 | -- | |
| Shea Brian | $39,000 | -- | |
| Jp Morgan Chase Bk | -- | -- | |
| Federal National Mortgage Association | $180,434 | -- | |
| Artey Pamela | $200,000 | -- |
Source: Public Records
Mortgage History
| Date | Status | Borrower | Loan Amount |
|---|---|---|---|
| Open | Quarshie Henry H | $76,000 | |
| Previous Owner | Artey Pamela | $160,000 |
Source: Public Records
Tax History Compared to Growth
Tax History
| Year | Tax Paid | Tax Assessment Tax Assessment Total Assessment is a certain percentage of the fair market value that is determined by local assessors to be the total taxable value of land and additions on the property. | Land | Improvement |
|---|---|---|---|---|
| 2025 | $2,055 | $155,800 | $0 | $155,800 |
| 2024 | $1,896 | $137,900 | $0 | $137,900 |
| 2023 | $1,731 | $120,700 | $0 | $120,700 |
| 2022 | $1,205 | $79,200 | $0 | $79,200 |
| 2021 | $1,216 | $74,700 | $0 | $74,700 |
| 2020 | $1,379 | $81,100 | $0 | $81,100 |
| 2019 | $1,408 | $78,200 | $0 | $78,200 |
| 2018 | $1,426 | $75,400 | $0 | $75,400 |
| 2017 | $1,540 | $80,100 | $0 | $80,100 |
| 2016 | $1,224 | $59,400 | $0 | $59,400 |
| 2015 | $911 | $45,400 | $0 | $45,400 |
| 2014 | $887 | $45,400 | $0 | $45,400 |
Source: Public Records
Map
Nearby Homes
- 12 Stoneland Rd
- 1025 Main St
- 1022 Main St
- 11 Nixon Ave
- 54 Richards St
- 56 Richards St
- 58 Richards St
- 60 Richards St Unit C
- 60 Richards St Unit B
- 52 Richards St
- 160 Fremont St Unit 211
- 4 Oliver St
- 40 Lakewood St
- 315 Cambridge St Unit 302A
- 7 Wyman St
- 25 Wyman St
- 14 Douglas Ct
- 14 Hancock St
- 11 Montague St
- 7 Circuit Ave E
- 17 Hitchock Unit 3
- 17 Hitchcock Rd Unit 3
- 17 Hitchcock Rd Unit 2
- 17 Hitchcock Rd Unit 1
- 21 Hitchcock Rd
- 21 Hitchcock Rd Unit 1
- 15 Hitchcock Rd
- 14 Stoneland Rd
- 16 Stoneland Rd
- 23 Hitchcock Rd
- 23 Hitchcock Rd Unit 3
- 18 Stoneland Rd
- 18 Hitchcock Rd
- 18 Hitchcock Rd Unit 2
- 18 Hitchcock Rd Unit 1
- 20 Hitchcock Rd
- 16 Hitchcock Rd
- 27 Hitchcock Rd
- 13 Hitchcock Rd
- 22 Hitchcock Rd