17 Hollon Way Shapleigh, ME 04076
Shapleigh NeighborhoodEstimated Value: $537,000
3
Beds
2
Baths
1,088
Sq Ft
$494/Sq Ft
Est. Value
About This Home
This home is located at 17 Hollon Way, Shapleigh, ME 04076 and is currently estimated at $537,000, approximately $493 per square foot. 17 Hollon Way is a home with nearby schools including Massabesic High School.
Ownership History
Date
Name
Owned For
Owner Type
Purchase Details
Closed on
Mar 7, 2023
Sold by
Hollon Way Llc
Bought by
Lapierre Kevin R and Lapierre Kimberly N
Current Estimated Value
Purchase Details
Closed on
Sep 28, 2012
Sold by
Dutch Bradford M
Bought by
Labonte Jason
Purchase Details
Closed on
Aug 2, 2010
Sold by
Bradford M Dutch Ft and Dutch Timothy C
Bought by
Dutch Bradford M
Purchase Details
Closed on
Dec 11, 2006
Sold by
Dutch Bradford M
Bought by
Bradford M Dutch Ft and Dutch
Create a Home Valuation Report for This Property
The Home Valuation Report is an in-depth analysis detailing your home's value as well as a comparison with similar homes in the area
Home Values in the Area
Average Home Value in this Area
Purchase History
| Date | Buyer | Sale Price | Title Company |
|---|---|---|---|
| Lapierre Kevin R | -- | None Available | |
| Lapierre Kevin R | -- | None Available | |
| Lapierre Kevin R | -- | None Available | |
| Labonte Jason | -- | -- | |
| Labonte Jason | -- | -- | |
| Dutch Bradford M | -- | -- | |
| Dutch Bradford M | -- | -- | |
| Bradford M Dutch Ft | -- | -- | |
| Bradford M Dutch Ft | -- | -- |
Source: Public Records
Tax History Compared to Growth
Tax History
| Year | Tax Paid | Tax Assessment Tax Assessment Total Assessment is a certain percentage of the fair market value that is determined by local assessors to be the total taxable value of land and additions on the property. | Land | Improvement |
|---|---|---|---|---|
| 2024 | $6,559 | $544,319 | $331,054 | $213,265 |
| 2023 | $5,770 | $544,319 | $331,054 | $213,265 |
| 2022 | $5,171 | $502,006 | $331,054 | $170,952 |
| 2021 | $4,564 | $445,243 | $323,054 | $122,189 |
| 2020 | $3,465 | $445,243 | $323,054 | $122,189 |
| 2019 | $3,465 | $445,243 | $323,054 | $122,189 |
| 2018 | $4,716 | $426,781 | $306,540 | $120,241 |
| 2017 | $3,371 | $426,781 | $306,540 | $120,241 |
| 2016 | $4,396 | $426,781 | $306,540 | $120,241 |
| 2015 | $4,268 | $426,781 | $306,540 | $120,241 |
| 2014 | $4,118 | $426,781 | $306,540 | $120,241 |
Source: Public Records
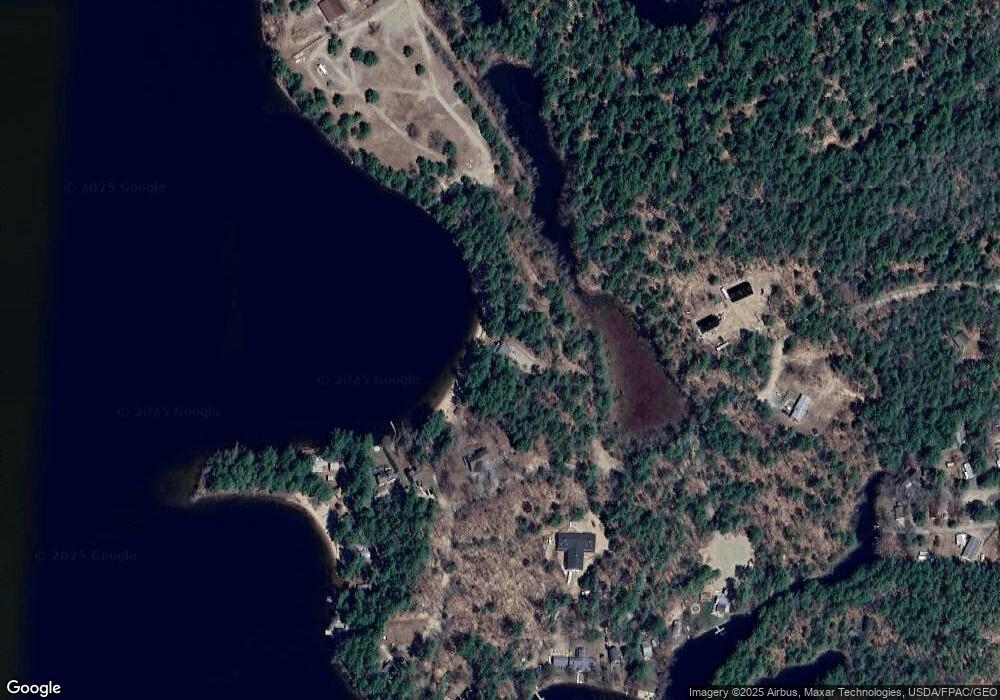
Map
Nearby Homes