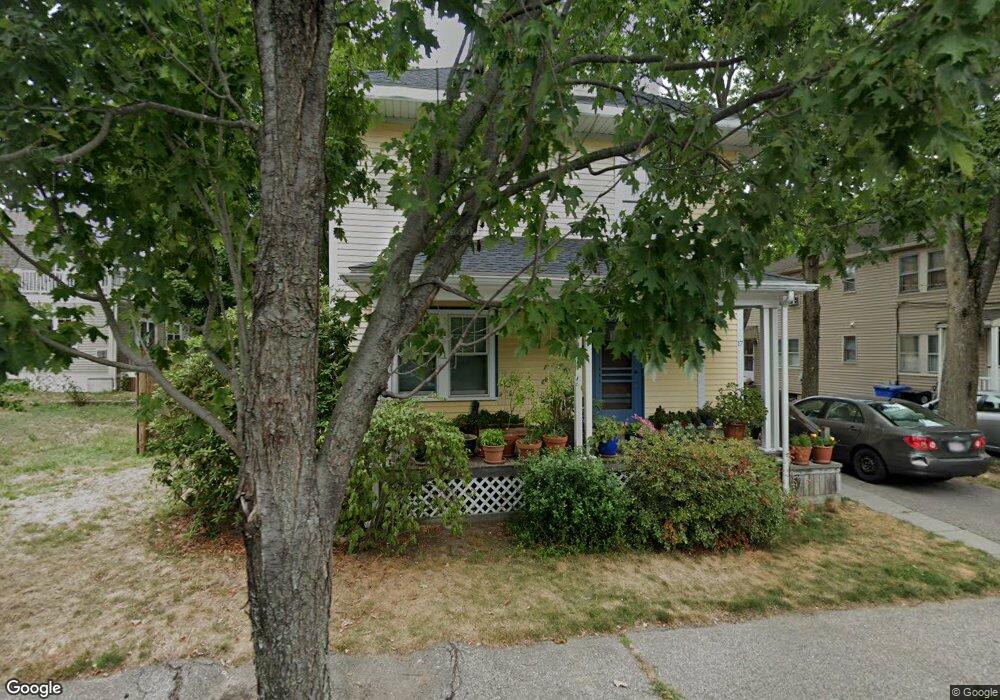
17 Holt St Belmont, MA 02478
Waverley Square NeighborhoodEstimated Value: $1,303,000 - $1,602,306
4
Beds
4
Baths
2,182
Sq Ft
$671/Sq Ft
Est. Value
About This Home
This home is located at 17 Holt St, Belmont, MA 02478 and is currently estimated at $1,463,077, approximately $670 per square foot. 17 Holt St is a home located in Middlesex County with nearby schools including Daniel Butler School, Winthrop L Chenery Middle School, and Belmont High School.
Ownership History
Date
Name
Owned For
Owner Type
Purchase Details
Closed on
Dec 21, 2020
Sold by
Covert Diane K and Covert Steven P
Bought by
Diane K Covert 2020 T
Current Estimated Value
Purchase Details
Closed on
Jun 30, 1989
Sold by
Knapp Frances O
Bought by
Covert Steven P
Create a Home Valuation Report for This Property
The Home Valuation Report is an in-depth analysis detailing your home's value as well as a comparison with similar homes in the area
Home Values in the Area
Average Home Value in this Area
Purchase History
| Date | Buyer | Sale Price | Title Company |
|---|---|---|---|
| Diane K Covert 2020 T | -- | None Available | |
| Covert Steven P | $150,000 | -- |
Source: Public Records
Mortgage History
| Date | Status | Borrower | Loan Amount |
|---|---|---|---|
| Previous Owner | Covert Steven P | $240,000 | |
| Previous Owner | Covert Steven P | $170,000 | |
| Previous Owner | Covert Steven P | $136,200 |
Source: Public Records
Tax History Compared to Growth
Tax History
| Year | Tax Paid | Tax Assessment Tax Assessment Total Assessment is a certain percentage of the fair market value that is determined by local assessors to be the total taxable value of land and additions on the property. | Land | Improvement |
|---|---|---|---|---|
| 2025 | $14,021 | $1,231,000 | $601,000 | $630,000 |
| 2024 | $13,665 | $1,294,000 | $795,000 | $499,000 |
| 2023 | $13,544 | $1,205,000 | $751,000 | $454,000 |
| 2022 | $12,843 | $1,111,000 | $687,000 | $424,000 |
| 2021 | $12,832 | $1,112,000 | $760,000 | $352,000 |
| 2020 | $11,044 | $1,004,000 | $634,000 | $370,000 |
| 2019 | $9,826 | $842,000 | $466,000 | $376,000 |
| 2018 | $9,720 | $800,000 | $424,000 | $376,000 |
| 2017 | $9,632 | $759,000 | $388,000 | $371,000 |
| 2016 | $8,955 | $713,000 | $345,000 | $368,000 |
| 2015 | $8,824 | $684,000 | $315,000 | $369,000 |
Source: Public Records
Map
Nearby Homes
- 17 Ripley Rd
- 1 Bridgham Ave
- 914 Belmont St
- 356 Lexington St
- 30 Duff St
- 28 Whitney St
- 57 Pierce Rd Unit 57
- 26 Ridge Rd
- 287 Lexington St
- 88 Bartlett Ave
- 99 Beech St
- 236 Sycamore St
- 3 Waverley St Unit 1
- 253 Sycamore St Unit 253
- 98 Carroll St Unit 98
- 24 Gill Rd Unit 4
- 103 Harnden Ave Unit 103
- 50 Moraine St
- 748 Belmont St
- 50 Carroll St Unit 50