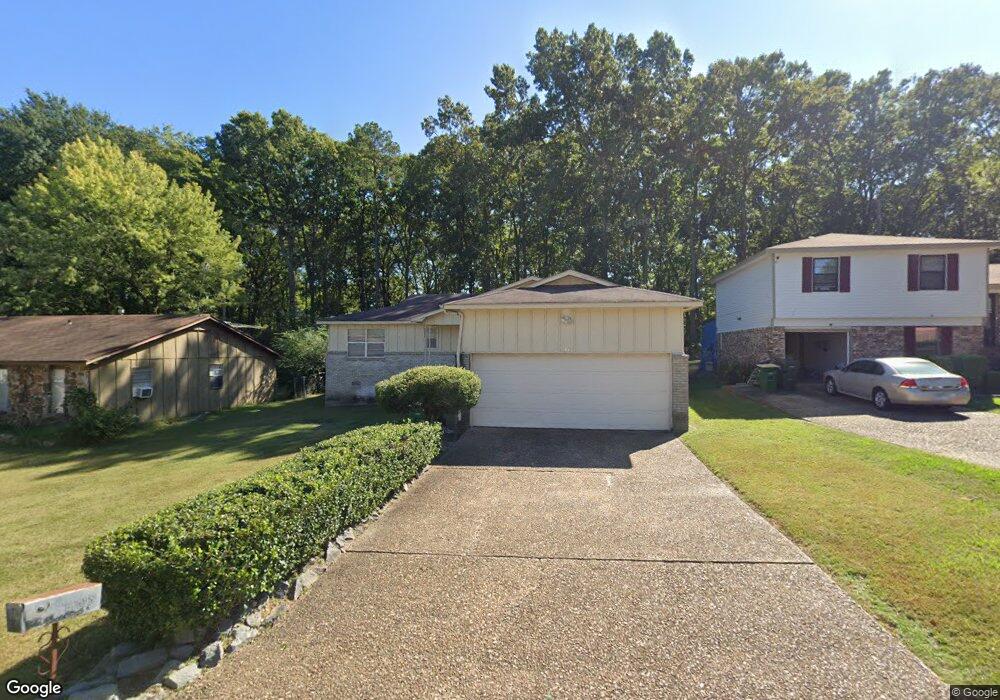
17 Howell Dr Little Rock, AR 72204
John Barrow NeighborhoodEstimated Value: $146,000 - $163,000
3
Beds
2
Baths
1,447
Sq Ft
$107/Sq Ft
Est. Value
About This Home
This home is located at 17 Howell Dr, Little Rock, AR 72204 and is currently estimated at $155,545, approximately $107 per square foot. 17 Howell Dr is a home located in Pulaski County with nearby schools including Brady Elementary School, J.A. Fair K8 Preparatory School, and Henderson Middle School.
Ownership History
Date
Name
Owned For
Owner Type
Purchase Details
Closed on
Apr 21, 2010
Sold by
Federal National Mortgage Association
Bought by
Morgan Deneshia J
Current Estimated Value
Home Financials for this Owner
Home Financials are based on the most recent Mortgage that was taken out on this home.
Original Mortgage
$86,174
Outstanding Balance
$57,138
Interest Rate
4.91%
Mortgage Type
FHA
Estimated Equity
$98,407
Purchase Details
Closed on
Nov 12, 2009
Sold by
Qualls Carolyn A
Bought by
Federal National Mortgage Association
Purchase Details
Closed on
Jan 30, 1997
Sold by
Finney Darrell and Finney Rebecca E
Bought by
Qualls Joseph L and Qualls Carolyn A
Home Financials for this Owner
Home Financials are based on the most recent Mortgage that was taken out on this home.
Original Mortgage
$61,912
Interest Rate
7.64%
Mortgage Type
FHA
Create a Home Valuation Report for This Property
The Home Valuation Report is an in-depth analysis detailing your home's value as well as a comparison with similar homes in the area
Home Values in the Area
Average Home Value in this Area
Purchase History
| Date | Buyer | Sale Price | Title Company |
|---|---|---|---|
| Morgan Deneshia J | $75,000 | Little Rock Title Company | |
| Federal National Mortgage Association | $76,019 | None Available | |
| Qualls Joseph L | $62,000 | American Abstract & Title Co |
Source: Public Records
Mortgage History
| Date | Status | Borrower | Loan Amount |
|---|---|---|---|
| Open | Morgan Deneshia J | $86,174 | |
| Previous Owner | Qualls Joseph L | $61,912 |
Source: Public Records
Tax History Compared to Growth
Tax History
| Year | Tax Paid | Tax Assessment Tax Assessment Total Assessment is a certain percentage of the fair market value that is determined by local assessors to be the total taxable value of land and additions on the property. | Land | Improvement |
|---|---|---|---|---|
| 2025 | $1,357 | $23,561 | $3,200 | $20,361 |
| 2024 | $1,244 | $23,561 | $3,200 | $20,361 |
| 2023 | $1,244 | $23,561 | $3,200 | $20,361 |
| 2022 | $1,187 | $23,561 | $3,200 | $20,361 |
| 2021 | $1,139 | $16,150 | $2,100 | $14,050 |
| 2020 | $756 | $16,150 | $2,100 | $14,050 |
| 2019 | $756 | $16,150 | $2,100 | $14,050 |
| 2018 | $781 | $16,150 | $2,100 | $14,050 |
| 2017 | $781 | $16,150 | $2,100 | $14,050 |
| 2016 | $925 | $18,220 | $3,300 | $14,920 |
| 2015 | $1,239 | $18,220 | $3,300 | $14,920 |
| 2014 | $1,239 | $17,677 | $3,300 | $14,377 |
Source: Public Records
Map
Nearby Homes
- 8300 W 23rd St
- 3918 W 23rd St
- Lot 42R Kanis Pines Dr
- 0000 Kanis Pines Dr
- Lot 39R Kanis Pines Dr
- 8001 Kanis Pines Dr
- 2208 Singleton Cove
- 8212 W 24th St
- Lot 9 Kanis Oaks Dr
- Lot 8 Kanis Oaks Dr
- 1900 Labette Manor Dr
- 1800 Labette Manor Dr
- 9203 Labette Dr
- 1813 Lynette Dr
- 7921 Kanis Oaks Dr
- 1622 Village Lake Dr
- 1625 Village Lake Dr
- 8904 Sage Meadows Dr
- 9320 Tanya Dr
- 2805 Longcoy St