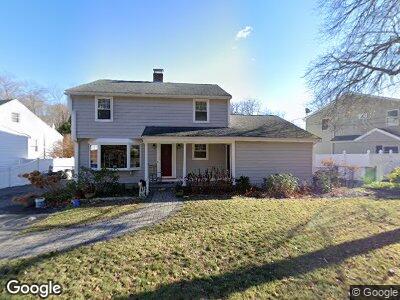
17 James St Winchester, MA 01890
West Side NeighborhoodEstimated Value: $1,014,000 - $1,377,000
4
Beds
3
Baths
2,084
Sq Ft
$595/Sq Ft
Est. Value
About This Home
This home is located at 17 James St, Winchester, MA 01890 and is currently estimated at $1,240,961, approximately $595 per square foot. 17 James St is a home located in Middlesex County with nearby schools including Vinson-Owen Elementary School, McCall Middle School, and Winchester High School.
Ownership History
Date
Name
Owned For
Owner Type
Purchase Details
Closed on
Jan 19, 2024
Sold by
Darcy Kathleen K
Bought by
Kathleen L Darcy Ret and Darcy
Current Estimated Value
Purchase Details
Closed on
Sep 15, 1997
Sold by
Minutoli Barbara J
Bought by
Darcy Kathleen K
Home Financials for this Owner
Home Financials are based on the most recent Mortgage that was taken out on this home.
Original Mortgage
$180,000
Interest Rate
7.31%
Mortgage Type
Purchase Money Mortgage
Create a Home Valuation Report for This Property
The Home Valuation Report is an in-depth analysis detailing your home's value as well as a comparison with similar homes in the area
Home Values in the Area
Average Home Value in this Area
Purchase History
| Date | Buyer | Sale Price | Title Company |
|---|---|---|---|
| Kathleen L Darcy Ret | -- | None Available | |
| Darcy Kathleen K | $240,000 | -- |
Source: Public Records
Mortgage History
| Date | Status | Borrower | Loan Amount |
|---|---|---|---|
| Previous Owner | Darcy Kathleen K | $180,000 | |
| Previous Owner | Darcy Kathleen K | $180,000 | |
| Previous Owner | Darcy Kathleen K | $180,000 | |
| Previous Owner | Darcy Kathleen K | $180,000 |
Source: Public Records
Tax History Compared to Growth
Tax History
| Year | Tax Paid | Tax Assessment Tax Assessment Total Assessment is a certain percentage of the fair market value that is determined by local assessors to be the total taxable value of land and additions on the property. | Land | Improvement |
|---|---|---|---|---|
| 2025 | $110 | $995,700 | $595,300 | $400,400 |
| 2024 | $10,921 | $963,900 | $595,300 | $368,600 |
| 2023 | $10,742 | $910,300 | $545,700 | $364,600 |
| 2022 | $9,244 | $738,900 | $413,400 | $325,500 |
| 2021 | $0 | $730,600 | $405,100 | $325,500 |
| 2020 | $9,052 | $730,600 | $405,100 | $325,500 |
| 2019 | $8,047 | $664,500 | $339,000 | $325,500 |
| 2018 | $7,282 | $639,100 | $322,400 | $316,700 |
| 2017 | $7,428 | $604,900 | $305,900 | $299,000 |
| 2016 | $6,962 | $596,100 | $305,900 | $290,200 |
| 2015 | $6,756 | $556,500 | $277,000 | $279,500 |
| 2014 | $6,464 | $510,600 | $239,800 | $270,800 |
Source: Public Records
Map
Nearby Homes