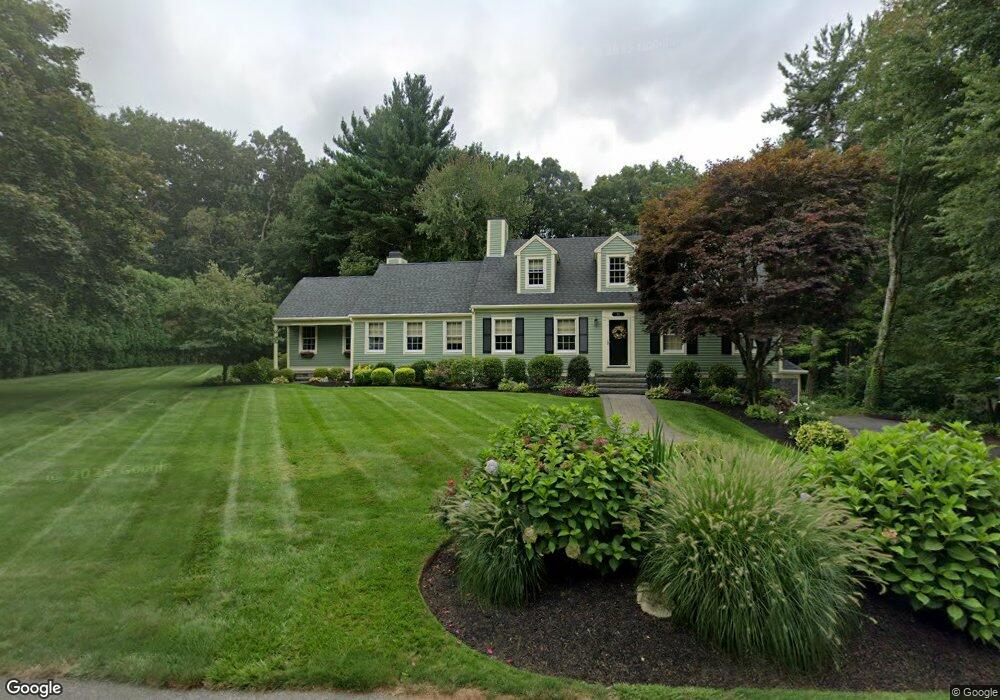
17 Jays Ln Hanover, MA 02339
Estimated Value: $1,036,827 - $1,307,000
4
Beds
4
Baths
2,680
Sq Ft
$430/Sq Ft
Est. Value
About This Home
This home is located at 17 Jays Ln, Hanover, MA 02339 and is currently estimated at $1,152,707, approximately $430 per square foot. 17 Jays Ln is a home located in Plymouth County with nearby schools including Hanover High School, Cadence Academy Preschool - Hanover, and The Master's Academy.
Ownership History
Date
Name
Owned For
Owner Type
Purchase Details
Closed on
Nov 18, 2010
Sold by
Foster Ann M
Bought by
Sherman Jarrod A and Sherman Christine
Current Estimated Value
Home Financials for this Owner
Home Financials are based on the most recent Mortgage that was taken out on this home.
Original Mortgage
$468,000
Outstanding Balance
$306,831
Interest Rate
4.3%
Mortgage Type
Purchase Money Mortgage
Estimated Equity
$845,876
Purchase Details
Closed on
Jun 21, 2002
Sold by
Alriviere Richard L and Alriviere Marie Lariviere
Bought by
Foster Ann M
Purchase Details
Closed on
Oct 1, 1993
Sold by
Paine Donald S and Paine Deborah M
Bought by
Lariviere Richard L and Lariviere Marie D
Purchase Details
Closed on
Sep 19, 1990
Sold by
Rossi Henry
Bought by
Paine Donald S
Create a Home Valuation Report for This Property
The Home Valuation Report is an in-depth analysis detailing your home's value as well as a comparison with similar homes in the area
Home Values in the Area
Average Home Value in this Area
Purchase History
| Date | Buyer | Sale Price | Title Company |
|---|---|---|---|
| Sherman Jarrod A | $585,000 | -- | |
| Sherman Jarrod A | $585,000 | -- | |
| Foster Ann M | $499,000 | -- | |
| Foster Ann M | $499,000 | -- | |
| Lariviere Richard L | $283,000 | -- | |
| Lariviere Richard L | $283,000 | -- | |
| Paine Donald S | $279,000 | -- | |
| Paine Donald S | $279,000 | -- |
Source: Public Records
Mortgage History
| Date | Status | Borrower | Loan Amount |
|---|---|---|---|
| Open | Sherman Jarrod A | $468,000 | |
| Closed | Paine Donald S | $468,000 | |
| Previous Owner | Paine Donald S | $385,000 |
Source: Public Records
Tax History Compared to Growth
Tax History
| Year | Tax Paid | Tax Assessment Tax Assessment Total Assessment is a certain percentage of the fair market value that is determined by local assessors to be the total taxable value of land and additions on the property. | Land | Improvement |
|---|---|---|---|---|
| 2025 | $11,525 | $933,200 | $337,500 | $595,700 |
| 2024 | $11,144 | $867,900 | $337,500 | $530,400 |
| 2023 | $11,145 | $826,200 | $306,700 | $519,500 |
| 2022 | $10,956 | $718,400 | $269,900 | $448,500 |
| 2021 | $13,638 | $676,700 | $245,300 | $431,400 |
| 2020 | $4,897 | $669,300 | $245,300 | $424,000 |
| 2019 | $10,435 | $635,900 | $267,600 | $368,300 |
| 2018 | $10,295 | $632,400 | $267,600 | $364,800 |
| 2017 | $9,790 | $592,600 | $272,000 | $320,600 |
| 2016 | $9,701 | $575,400 | $247,300 | $328,100 |
| 2015 | $9,052 | $560,500 | $247,300 | $313,200 |
Source: Public Records
Map
Nearby Homes
- 265 Silver St
- 14 Longwood Ln Unit 14
- 62 Larchmont Ln
- 250 Center St
- 51 Cervelli Farm Dr
- 37 Dr
- 23 Cervelli Farm Dr
- 38 Cervelli Farm Dr
- 9 Cervelli Farm Dr
- 53 Chestnut St
- 8 Old Farm Rd
- 436 Center St
- 276 Woodland Dr
- 114 Graham Hill Dr
- 186 Elm St
- 180 Elm St
- 26 Church St
- 20 Meadow Brook Rd
- 118 Bates Way
- 70 Dillingham Way