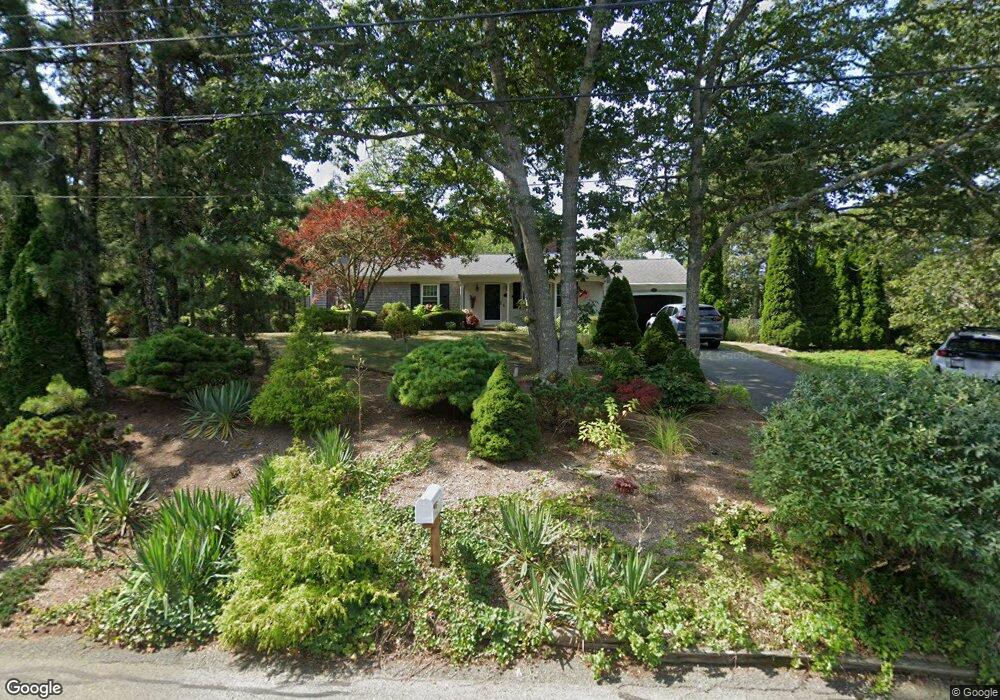
17 Joshua Jethro Rd Chatham, MA 02633
North Chatham NeighborhoodEstimated Value: $831,000 - $966,000
3
Beds
2
Baths
1,201
Sq Ft
$742/Sq Ft
Est. Value
About This Home
This home is located at 17 Joshua Jethro Rd, Chatham, MA 02633 and is currently estimated at $890,615, approximately $741 per square foot. 17 Joshua Jethro Rd is a home located in Barnstable County with nearby schools including Chatham Elementary School, Harwich Elementary School, and Monomoy Regional Middle School.
Ownership History
Date
Name
Owned For
Owner Type
Purchase Details
Closed on
Mar 28, 2022
Sold by
Doherty Kathleen M
Bought by
Doherty Kathleen M and Doherty Kara
Current Estimated Value
Purchase Details
Closed on
Jun 12, 2000
Sold by
Duwors Agnes E
Bought by
Thomas Richard W and Thomas Christine S
Home Financials for this Owner
Home Financials are based on the most recent Mortgage that was taken out on this home.
Original Mortgage
$186,800
Interest Rate
8.12%
Mortgage Type
Purchase Money Mortgage
Purchase Details
Closed on
Jan 12, 1998
Sold by
Gallacher John M and Gallacher Virginia M
Bought by
Doherty James A and Doherty Kathleen M
Home Financials for this Owner
Home Financials are based on the most recent Mortgage that was taken out on this home.
Original Mortgage
$134,000
Interest Rate
7.09%
Mortgage Type
Purchase Money Mortgage
Create a Home Valuation Report for This Property
The Home Valuation Report is an in-depth analysis detailing your home's value as well as a comparison with similar homes in the area
Home Values in the Area
Average Home Value in this Area
Purchase History
| Date | Buyer | Sale Price | Title Company |
|---|---|---|---|
| Doherty Kathleen M | -- | None Available | |
| Thomas Richard W | $235,000 | -- | |
| Doherty James A | $158,700 | -- |
Source: Public Records
Mortgage History
| Date | Status | Borrower | Loan Amount |
|---|---|---|---|
| Previous Owner | Thomas Richard W | $102,000 | |
| Previous Owner | Thomas Richard W | $186,800 | |
| Previous Owner | Doherty James A | $134,000 |
Source: Public Records
Tax History Compared to Growth
Tax History
| Year | Tax Paid | Tax Assessment Tax Assessment Total Assessment is a certain percentage of the fair market value that is determined by local assessors to be the total taxable value of land and additions on the property. | Land | Improvement |
|---|---|---|---|---|
| 2025 | $2,413 | $695,500 | $317,800 | $377,700 |
| 2024 | $2,361 | $661,400 | $299,800 | $361,600 |
| 2023 | $2,246 | $578,800 | $249,800 | $329,000 |
| 2022 | $2,207 | $477,700 | $249,800 | $227,900 |
| 2021 | $2,179 | $437,500 | $227,100 | $210,400 |
| 2020 | $2,086 | $432,800 | $227,100 | $205,700 |
| 2019 | $2,027 | $418,000 | $212,300 | $205,700 |
| 2018 | $1,934 | $397,100 | $212,300 | $184,800 |
| 2017 | $1,940 | $385,700 | $206,100 | $179,600 |
| 2016 | $1,899 | $378,200 | $202,100 | $176,100 |
| 2015 | $1,833 | $367,300 | $196,300 | $171,000 |
| 2014 | $1,865 | $367,100 | $196,300 | $170,800 |
Source: Public Records
Map
Nearby Homes
- 46 Chippingstone Rd
- 319 Riverview Dr
- 28 Lakeview Ave
- 49 Duck Marsh Ln
- 33 Duck Marsh Ln
- 24 Chickadee Cir
- 24 Chickadee Ln
- 58 Sugar Hill Dr
- 1761 Main St
- 0 George Ryder Rd Unit 73104629
- 0 George Ryder Rd Unit 22301591
- 76 Williamsburg Ave
- 0 Evergreen Ln
- 99 A Leonard Way
- 44 Old Heritage Way
- 56 Skyline Dr
- 29 Jessies Landing
- 2386 Main St
- 207 Horizon Dr
- 22 Pine Knoll Ave
- 11 Chippingstone Rd
- 10 Swift Ln
- 0 Swift Ln
- 24 Joshua Jethro Rd
- 10 Joshua Jethro Rd
- 45 Joshua Jethro Rd
- 36 Joshua Jethro Rd
- 10 Chippingstone Rd
- 0 Joshua Jethro Rd
- 28 Chippingstone Rd
- 41 Swift Ln
- 43 Chippingstone Rd
- 22 Wading Place Path
- 59 Joshua Jethro Rd
- 978 Old Queen Anne Rd
- 37 Swift Ln
- 9 Wading Place Path
- 36 Swift Ln
- 33 Wading Point
- 48 Wading Place Path