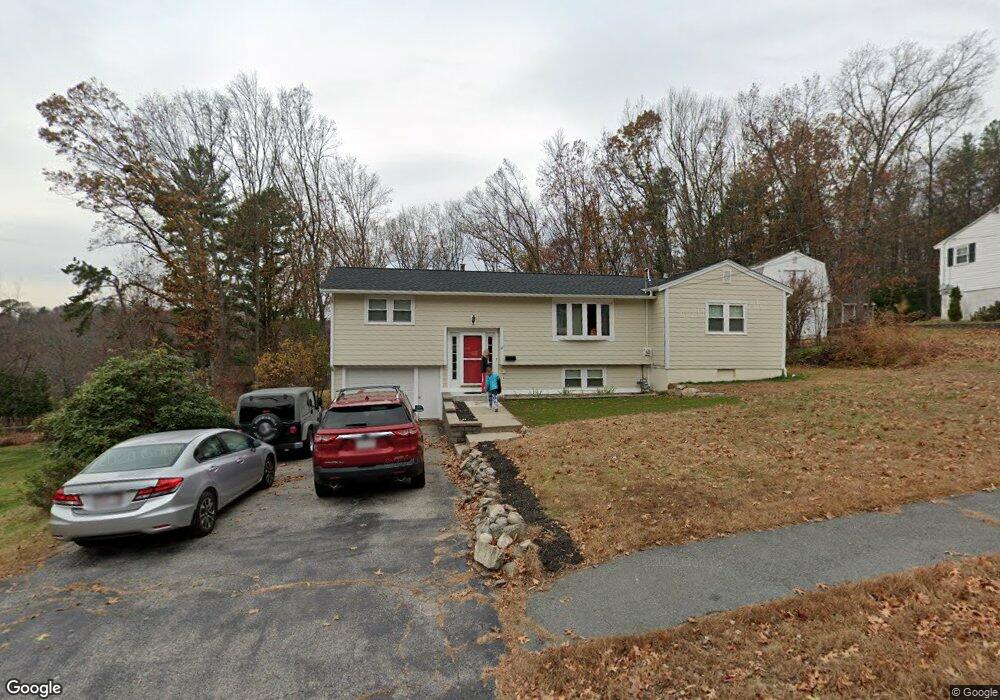
17 Kent Dr Hudson, MA 01749
Estimated Value: $620,934 - $696,000
4
Beds
2
Baths
1,714
Sq Ft
$379/Sq Ft
Est. Value
About This Home
This home is located at 17 Kent Dr, Hudson, MA 01749 and is currently estimated at $648,984, approximately $378 per square foot. 17 Kent Dr is a home located in Middlesex County with nearby schools including David J. Quinn Middle School, Hudson High School, and First Steps Children's Center.
Ownership History
Date
Name
Owned For
Owner Type
Purchase Details
Closed on
May 12, 2017
Sold by
Sallese Robert J and Sallese Karen M
Bought by
Osborne Paul D and Harding-Osborne Cassie
Current Estimated Value
Home Financials for this Owner
Home Financials are based on the most recent Mortgage that was taken out on this home.
Original Mortgage
$319,000
Outstanding Balance
$265,578
Interest Rate
4.14%
Mortgage Type
New Conventional
Estimated Equity
$383,406
Create a Home Valuation Report for This Property
The Home Valuation Report is an in-depth analysis detailing your home's value as well as a comparison with similar homes in the area
Home Values in the Area
Average Home Value in this Area
Purchase History
| Date | Buyer | Sale Price | Title Company |
|---|---|---|---|
| Osborne Paul D | $399,900 | -- | |
| Osborne Paul D | $399,900 | -- |
Source: Public Records
Mortgage History
| Date | Status | Borrower | Loan Amount |
|---|---|---|---|
| Open | Osborne Paul D | $319,000 | |
| Closed | Osborne Paul D | $319,000 |
Source: Public Records
Tax History
| Year | Tax Paid | Tax Assessment Tax Assessment Total Assessment is a certain percentage of the fair market value that is determined by local assessors to be the total taxable value of land and additions on the property. | Land | Improvement |
|---|---|---|---|---|
| 2025 | $7,304 | $526,200 | $210,000 | $316,200 |
| 2024 | $6,964 | $497,400 | $191,000 | $306,400 |
| 2023 | $7,020 | $480,800 | $183,800 | $297,000 |
| 2022 | $6,832 | $430,800 | $167,000 | $263,800 |
| 2021 | $6,450 | $388,800 | $159,000 | $229,800 |
| 2020 | $6,406 | $385,700 | $155,900 | $229,800 |
| 2019 | $6,161 | $361,800 | $155,900 | $205,900 |
| 2018 | $5,637 | $322,100 | $148,400 | $173,700 |
| 2017 | $5,693 | $325,300 | $141,500 | $183,800 |
| 2016 | $5,248 | $303,500 | $141,500 | $162,000 |
| 2015 | $4,732 | $274,000 | $141,500 | $132,500 |
| 2014 | $4,378 | $251,300 | $124,000 | $127,300 |
Source: Public Records
Map
Nearby Homes
- 265 Manning St
- 399 Long Hill Rd
- 32 Stratton Dr
- 200 Manning St Unit 20A
- 200 Manning St Unit 6B
- 26 Old Bolton Rd
- 25 Richard Rd
- 133 Lincoln St
- 2 Barracks Rd Unit 2
- 128 Manning St
- 12 Old County Rd Unit 20
- 0 Long Hill Rd
- 37 Tower St
- 28 Pierce St
- 26 Marychris Dr
- 46 Church St Unit 2
- 21 Felton St
- 16 Barnes Blvd Unit 16
- 18-24 River St Unit 12
- 304 Cox St
Your Personal Tour Guide
Ask me questions while you tour the home.