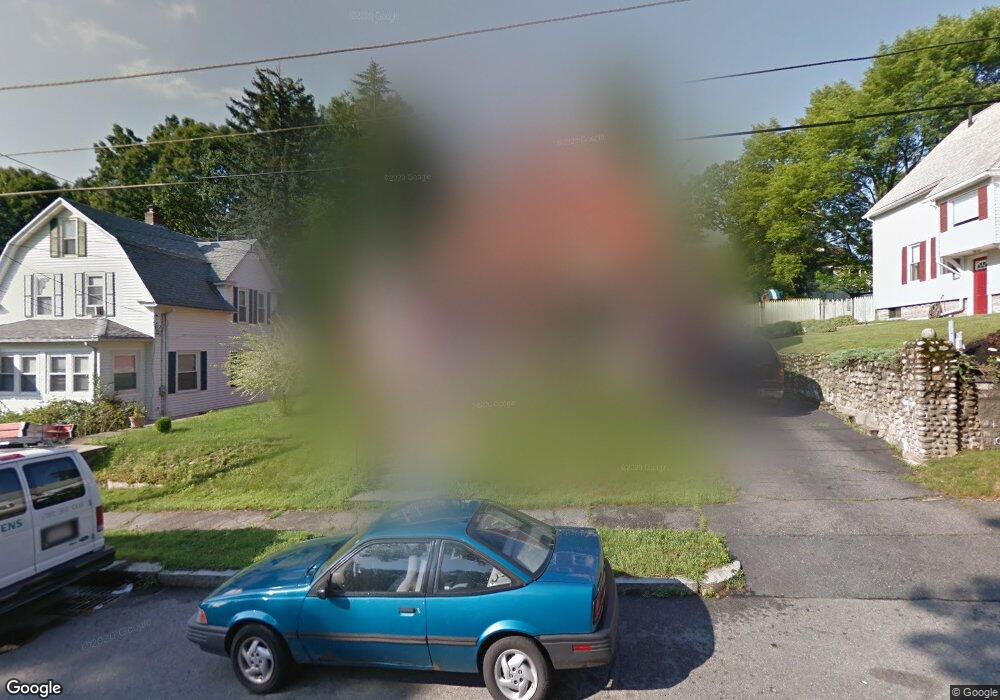
17 Knox St Worcester, MA 01603
Hadwen Park NeighborhoodEstimated Value: $442,000 - $587,000
4
Beds
3
Baths
1,820
Sq Ft
$269/Sq Ft
Est. Value
About This Home
This home is located at 17 Knox St, Worcester, MA 01603 and is currently estimated at $490,226, approximately $269 per square foot. 17 Knox St is a home located in Worcester County with nearby schools including Jacob Hiatt Magnet School, Chandler Magnet, and Heard Street Discovery Academy.
Ownership History
Date
Name
Owned For
Owner Type
Purchase Details
Closed on
Oct 2, 2025
Sold by
4J Real Estate Group Llc
Bought by
Alachoyan Danielle M
Current Estimated Value
Home Financials for this Owner
Home Financials are based on the most recent Mortgage that was taken out on this home.
Original Mortgage
$440,000
Outstanding Balance
$438,819
Interest Rate
6.58%
Mortgage Type
New Conventional
Estimated Equity
$51,407
Purchase Details
Closed on
May 16, 2024
Sold by
4J Real Estate Group Llc and Aviles
Bought by
4J Real Estate Group Llc
Home Financials for this Owner
Home Financials are based on the most recent Mortgage that was taken out on this home.
Original Mortgage
$315,782
Interest Rate
6.82%
Mortgage Type
Purchase Money Mortgage
Purchase Details
Closed on
Feb 20, 2024
Sold by
Dennison Deborah
Bought by
4J Real Estate Group Llc and Aviles
Purchase Details
Closed on
Dec 4, 2003
Sold by
Inzerillo Paula L and Simpson Paula L
Bought by
Dennison Deborha and Dennison Raymond
Purchase Details
Closed on
Feb 22, 2000
Sold by
Ashworth John H and Ashworth Janet L
Bought by
Inzerillo Paula L
Create a Home Valuation Report for This Property
The Home Valuation Report is an in-depth analysis detailing your home's value as well as a comparison with similar homes in the area
Home Values in the Area
Average Home Value in this Area
Purchase History
| Date | Buyer | Sale Price | Title Company |
|---|---|---|---|
| Alachoyan Danielle M | $550,000 | -- | |
| 4J Real Estate Group Llc | $40,000 | None Available | |
| 4J Real Estate Group Llc | $261,000 | None Available | |
| Dennison Deborha | $177,000 | -- | |
| Dennison Deborha | $177,000 | -- | |
| Dennison Deborha | $177,000 | -- | |
| Inzerillo Paula L | $121,500 | -- | |
| Inzerillo Paula L | $121,500 | -- |
Source: Public Records
Mortgage History
| Date | Status | Borrower | Loan Amount |
|---|---|---|---|
| Open | Alachoyan Danielle M | $440,000 | |
| Previous Owner | 4J Real Estate Group Llc | $315,782 | |
| Previous Owner | Inzerillo Paula L | $140,000 | |
| Previous Owner | Inzerillo Paula L | $30,000 |
Source: Public Records
Tax History
| Year | Tax Paid | Tax Assessment Tax Assessment Total Assessment is a certain percentage of the fair market value that is determined by local assessors to be the total taxable value of land and additions on the property. | Land | Improvement |
|---|---|---|---|---|
| 2025 | $4,412 | $334,500 | $95,500 | $239,000 |
| 2024 | $4,228 | $307,500 | $95,500 | $212,000 |
| 2023 | $4,071 | $283,900 | $83,000 | $200,900 |
| 2022 | $3,766 | $247,600 | $66,400 | $181,200 |
| 2021 | $3,606 | $221,500 | $53,100 | $168,400 |
| 2020 | $3,427 | $201,600 | $52,800 | $148,800 |
| 2019 | $3,271 | $181,700 | $46,000 | $135,700 |
| 2018 | $3,256 | $172,200 | $46,000 | $126,200 |
| 2017 | $3,116 | $162,100 | $46,000 | $116,100 |
| 2016 | $3,092 | $150,000 | $32,900 | $117,100 |
| 2015 | $3,011 | $150,000 | $32,900 | $117,100 |
| 2014 | $2,931 | $150,000 | $32,900 | $117,100 |
Source: Public Records
Map
Nearby Homes
- 99 Clover St
- 11 Hulbert Rd Unit 13
- 35 Genessee St Unit E
- 5 Commonwealth Ave
- 103 Henshaw St
- 25 Vinal St Unit 28
- 25 Vinal St Unit 26
- 25 Vinal St Unit 29
- 25 Vinal St Unit 30
- 55 Grandview Ave
- 2 Montague St
- 27 Havana Rd
- 1034 Southbridge St
- 26 Sylvan St
- 23 Lakewood St
- 27 Montague St
- 177 Oxford St N
- 315 Stafford St
- 32 Goddard Memorial Dr
- 12 Stoneland Rd
Your Personal Tour Guide
Ask me questions while you tour the home.