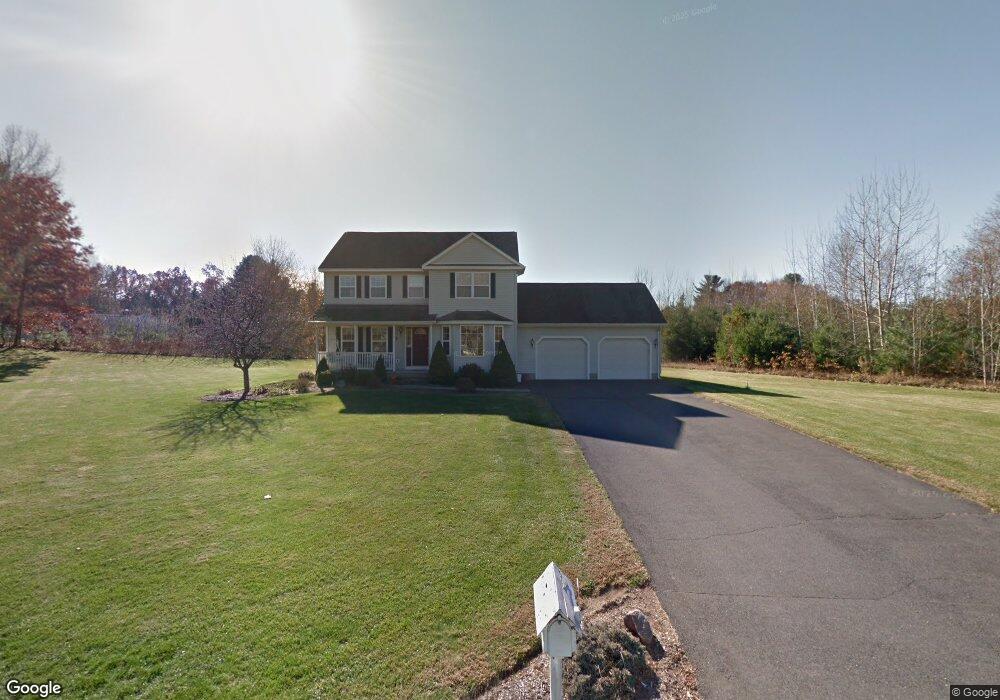
17 Laurel Dr Easthampton, MA 01027
Estimated Value: $573,872 - $632,000
4
Beds
3
Baths
2,030
Sq Ft
$298/Sq Ft
Est. Value
About This Home
This home is located at 17 Laurel Dr, Easthampton, MA 01027 and is currently estimated at $604,468, approximately $297 per square foot. 17 Laurel Dr is a home located in Hampshire County with nearby schools including Easthampton High School, Calvary Baptist Christian School, and Tri-County Schools.
Ownership History
Date
Name
Owned For
Owner Type
Purchase Details
Closed on
Aug 28, 2002
Sold by
Terezakis Barbara L and Terezakis Terry N
Bought by
Kubasek Dana M and Kubasek James M
Current Estimated Value
Purchase Details
Closed on
Sep 8, 1998
Sold by
Crown Meadow Corp
Bought by
Terezakis Terry N
Create a Home Valuation Report for This Property
The Home Valuation Report is an in-depth analysis detailing your home's value as well as a comparison with similar homes in the area
Home Values in the Area
Average Home Value in this Area
Purchase History
| Date | Buyer | Sale Price | Title Company |
|---|---|---|---|
| Kubasek Dana M | $245,500 | -- | |
| Terezakis Terry N | $197,329 | -- |
Source: Public Records
Mortgage History
| Date | Status | Borrower | Loan Amount |
|---|---|---|---|
| Open | Terezakis Terry N | $170,000 | |
| Closed | Terezakis Terry N | $65,000 | |
| Closed | Terezakis Terry N | $156,000 |
Source: Public Records
Tax History
| Year | Tax Paid | Tax Assessment Tax Assessment Total Assessment is a certain percentage of the fair market value that is determined by local assessors to be the total taxable value of land and additions on the property. | Land | Improvement |
|---|---|---|---|---|
| 2025 | $6,778 | $495,800 | $139,000 | $356,800 |
| 2024 | $6,536 | $482,000 | $135,100 | $346,900 |
| 2023 | $5,072 | $346,200 | $105,800 | $240,400 |
| 2022 | $5,723 | $346,200 | $105,800 | $240,400 |
| 2021 | $6,302 | $359,300 | $105,800 | $253,500 |
| 2020 | $6,149 | $346,200 | $105,800 | $240,400 |
| 2019 | $5,544 | $358,600 | $123,400 | $235,200 |
| 2018 | $5,333 | $333,300 | $116,400 | $216,900 |
| 2017 | $5,203 | $321,000 | $112,000 | $209,000 |
| 2016 | $5,071 | $325,300 | $112,000 | $213,300 |
| 2015 | $4,928 | $325,300 | $112,000 | $213,300 |
Source: Public Records
Map
Nearby Homes
Your Personal Tour Guide
Ask me questions while you tour the home.