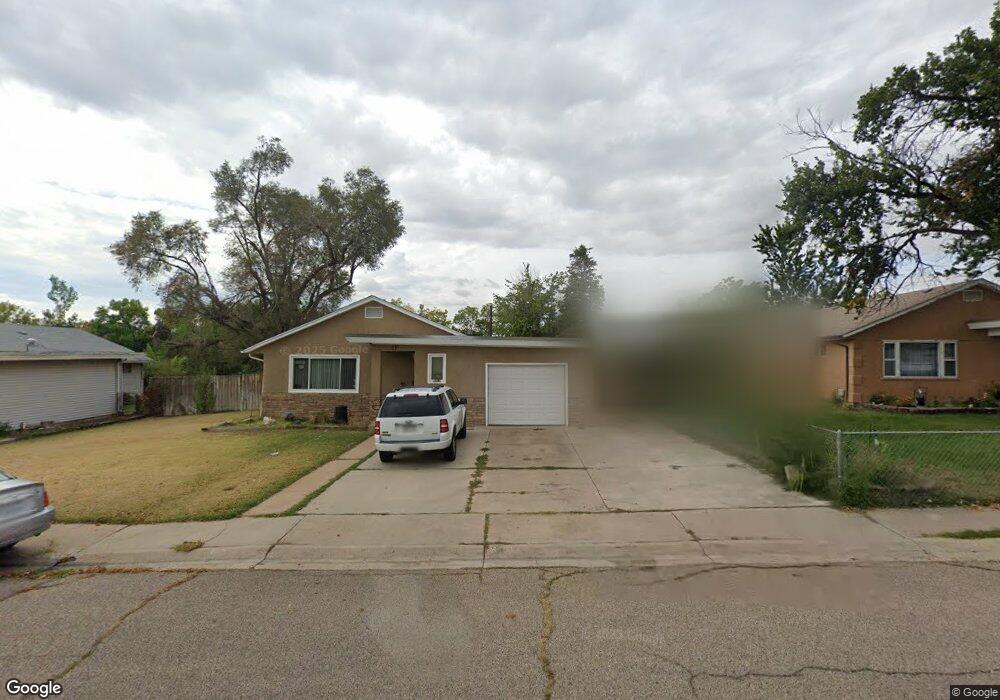
17 Loch Lomond Ln Pueblo, CO 81001
Belmont NeighborhoodEstimated Value: $241,118 - $262,000
3
Beds
2
Baths
1,305
Sq Ft
$192/Sq Ft
Est. Value
About This Home
This home is located at 17 Loch Lomond Ln, Pueblo, CO 81001 and is currently estimated at $251,030, approximately $192 per square foot. 17 Loch Lomond Ln is a home located in Pueblo County with nearby schools including Belmont Elementary School, Heaton Middle School, and East High School.
Ownership History
Date
Name
Owned For
Owner Type
Purchase Details
Closed on
Sep 19, 2007
Sold by
Behringer Janet N and Behringer Verland F
Bought by
Bevsek Brian G
Current Estimated Value
Purchase Details
Closed on
Mar 1, 2006
Sold by
Behringer Janet N and Behringer Verland F
Bought by
Behringer Janet N and Behringer Verland F
Purchase Details
Closed on
Oct 4, 2005
Sold by
Behringer Janet N and Behringer Verland F
Bought by
Behringer Janet N and Behringer Verland F
Purchase Details
Closed on
Apr 11, 2005
Sold by
Harris Jesse D
Bought by
Behringer Janet N and Behringer Verland F
Home Financials for this Owner
Home Financials are based on the most recent Mortgage that was taken out on this home.
Original Mortgage
$91,500
Interest Rate
5.75%
Mortgage Type
Fannie Mae Freddie Mac
Purchase Details
Closed on
Jan 7, 2005
Sold by
Catholic Charities Of The Diocese Of Pue
Bought by
Harris Jesse D
Purchase Details
Closed on
Aug 9, 1972
Sold by
Lovelace and Radok
Bought by
Lovelace Claire C
Create a Home Valuation Report for This Property
The Home Valuation Report is an in-depth analysis detailing your home's value as well as a comparison with similar homes in the area
Home Values in the Area
Average Home Value in this Area
Purchase History
| Date | Buyer | Sale Price | Title Company |
|---|---|---|---|
| Bevsek Brian G | -- | None Available | |
| Behringer Janet N | -- | None Available | |
| Behringer Janet N | -- | -- | |
| Behringer Janet N | $101,500 | Land Title Guarantee Company | |
| Harris Jesse D | $80,500 | -- | |
| Lovelace Claire C | -- | -- |
Source: Public Records
Mortgage History
| Date | Status | Borrower | Loan Amount |
|---|---|---|---|
| Previous Owner | Behringer Janet N | $91,500 |
Source: Public Records
Tax History Compared to Growth
Tax History
| Year | Tax Paid | Tax Assessment Tax Assessment Total Assessment is a certain percentage of the fair market value that is determined by local assessors to be the total taxable value of land and additions on the property. | Land | Improvement |
|---|---|---|---|---|
| 2024 | $1,037 | $10,550 | -- | -- |
| 2023 | $1,049 | $14,240 | $1,340 | $12,900 |
| 2022 | $1,147 | $11,550 | $1,390 | $10,160 |
| 2021 | $1,183 | $11,880 | $1,430 | $10,450 |
| 2020 | $942 | $11,880 | $1,430 | $10,450 |
| 2019 | $942 | $9,326 | $751 | $8,575 |
| 2018 | $696 | $7,676 | $756 | $6,920 |
| 2017 | $703 | $7,676 | $756 | $6,920 |
| 2016 | $674 | $7,422 | $836 | $6,586 |
| 2015 | $672 | $7,422 | $836 | $6,586 |
| 2014 | $655 | $7,225 | $836 | $6,389 |
Source: Public Records
Map
Nearby Homes
- 11 Macnaughton Rd
- 18 Dundee Ln
- 1814 Lark Bunting Ln
- 1712 Alexander Cir
- 62 Louis Nelson Rd
- 36 Scotland Rd
- 69 Macnaughton Rd
- 5 Douglas Ln
- 1828 Bonforte Blvd
- 1706 Comanche Rd
- 2 Alan Shepard Rd Unit 8
- 9 Briargate Place
- 178 Macneil Place
- 1426 Bonforte Blvd
- 1534 Saratoga Rd
- 1518 Horseshoe Dr
- 172 Bonnymede Rd
- 172 Bonnymede Rd Unit A
- 172 Bonnymede Rd Unit C
- 130 Scotland Rd Unit D
- 15 Loch Lomond Ln
- 19 Loch Lomond Ln
- 20 Macnaughton Rd
- 18 Macnaughton Rd
- 13 Loch Lomond Ln
- 22 Macnaughton Rd
- 16 Macnaughton Rd
- 25 Loch Lomond Ln
- 16 Loch Lomond Ln
- 24 Macnaughton Rd
- 18 Loch Lomond Ln
- 14 Loch Lomond Ln
- 9 Loch Lomond Ln
- 14 Macnaughton Rd
- 20 Loch Lomond Ln
- 26 Macnaughton Rd
- 29 Loch Lomond Ln
- 12 Loch Lomond Ln
- 12 Macnaughton Rd
- 11 Loch Lomond Ln