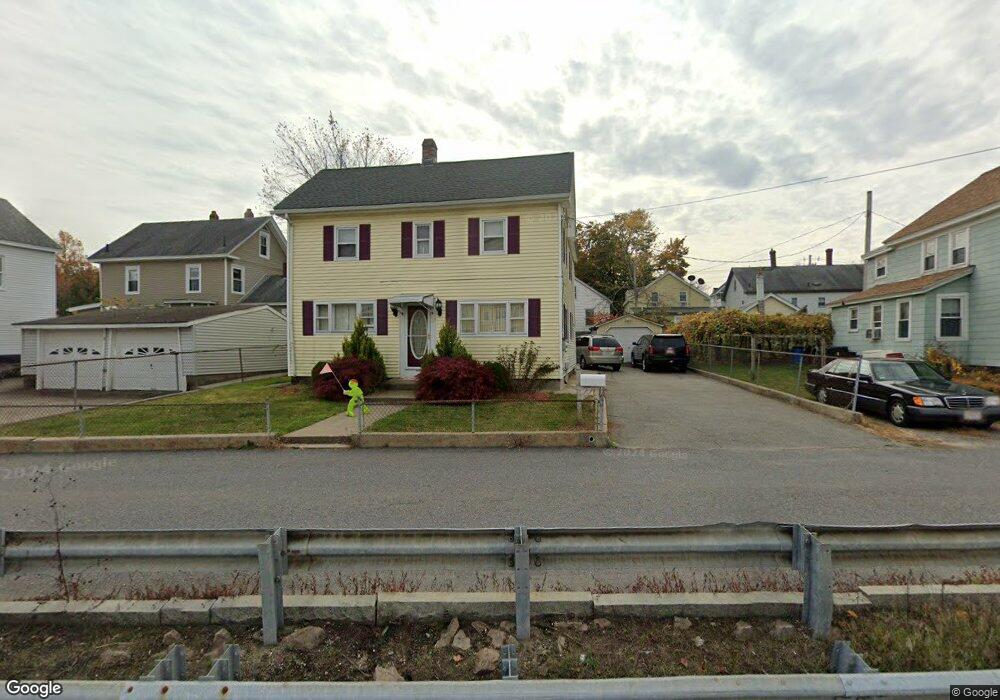
17 Loring Ct Hudson, MA 01749
Downtown Hudson NeighborhoodEstimated Value: $452,000 - $554,000
4
Beds
2
Baths
1,468
Sq Ft
$331/Sq Ft
Est. Value
About This Home
This home is located at 17 Loring Ct, Hudson, MA 01749 and is currently estimated at $486,259, approximately $331 per square foot. 17 Loring Ct is a home located in Middlesex County with nearby schools including David J. Quinn Middle School, Hudson High School, and First Steps Children's Center.
Ownership History
Date
Name
Owned For
Owner Type
Purchase Details
Closed on
Jun 30, 2021
Sold by
Luz Antonio F and Luz Maria F
Bought by
Siruge-Neto Miguel
Current Estimated Value
Home Financials for this Owner
Home Financials are based on the most recent Mortgage that was taken out on this home.
Original Mortgage
$342,000
Outstanding Balance
$310,312
Interest Rate
2.9%
Mortgage Type
Purchase Money Mortgage
Estimated Equity
$175,947
Create a Home Valuation Report for This Property
The Home Valuation Report is an in-depth analysis detailing your home's value as well as a comparison with similar homes in the area
Home Values in the Area
Average Home Value in this Area
Purchase History
| Date | Buyer | Sale Price | Title Company |
|---|---|---|---|
| Siruge-Neto Miguel | $360,000 | None Available | |
| Siruge-Neto Miguel | $360,000 | None Available |
Source: Public Records
Mortgage History
| Date | Status | Borrower | Loan Amount |
|---|---|---|---|
| Open | Siruge-Neto Miguel | $342,000 | |
| Closed | Siruge-Neto Miguel | $342,000 |
Source: Public Records
Tax History Compared to Growth
Tax History
| Year | Tax Paid | Tax Assessment Tax Assessment Total Assessment is a certain percentage of the fair market value that is determined by local assessors to be the total taxable value of land and additions on the property. | Land | Improvement |
|---|---|---|---|---|
| 2025 | $5,785 | $416,800 | $157,400 | $259,400 |
| 2024 | $5,463 | $390,200 | $143,000 | $247,200 |
| 2023 | $5,285 | $362,000 | $137,600 | $224,400 |
| 2022 | $4,744 | $299,100 | $125,100 | $174,000 |
| 2021 | $4,630 | $279,100 | $119,100 | $160,000 |
| 2020 | $4,329 | $260,600 | $116,800 | $143,800 |
| 2019 | $4,419 | $259,500 | $116,800 | $142,700 |
| 2018 | $4,142 | $236,700 | $111,200 | $125,500 |
| 2017 | $3,843 | $219,600 | $106,000 | $113,600 |
| 2016 | $3,723 | $215,300 | $106,000 | $109,300 |
| 2015 | $3,551 | $205,600 | $106,000 | $99,600 |
| 2014 | $3,360 | $192,900 | $92,900 | $100,000 |
Source: Public Records
Map
Nearby Homes
- 248 Main St Unit 207
- 248 Main St Unit 216
- 11 Barracks Rd Unit 11
- 9 Barracks Rd Unit 9
- 3 Barracks Rd Unit 3
- 7 Barracks Rd Unit 7
- 5 Barracks Rd Unit 5
- 16 Houghton St
- 34 Forest Ave
- 65 Main St
- 56 Forest Ave
- 17 School St Unit C
- 17 School St Unit A
- 18-24 River St Unit 1
- 107 Washington St
- 74 Cox St Unit 9
- 56 Park St
- 26 Marychris Dr
- 55 Cottage St
- 4 Linden St
- 15 Loring Ct
- 5 Grove St
- 3 Grove St
- 3 Grove St Unit 2
- 32 Loring St
- 7 Grove St Unit 1
- 7 Grove St
- 36 Loring St
- 7 Grove St Unit 11
- 7 Grove St Unit 2
- 7-11 Grove St
- 20 Loring St
- 11 Grove St
- 241 Main St
- 241 Main St Unit 1
- 241 Main St Unit 3
- 27 Loring St
- 29 Loring St
- 27 Loring St Unit 27
- 27 Loring St Unit 1