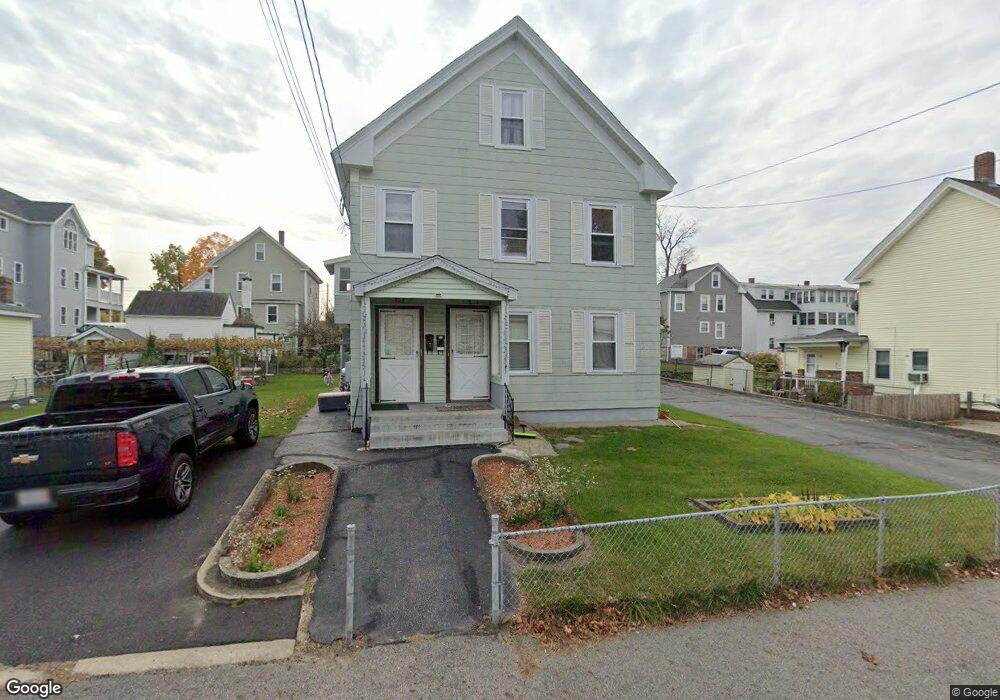
17 Loring St Hudson, MA 01749
Downtown Hudson NeighborhoodEstimated Value: $522,863 - $567,000
4
Beds
2
Baths
1,876
Sq Ft
$293/Sq Ft
Est. Value
About This Home
This home is located at 17 Loring St, Hudson, MA 01749 and is currently estimated at $548,966, approximately $292 per square foot. 17 Loring St is a home located in Middlesex County with nearby schools including David J. Quinn Middle School, Hudson High School, and First Steps Children's Center.
Ownership History
Date
Name
Owned For
Owner Type
Purchase Details
Closed on
Dec 1, 2016
Sold by
Jose A Fontes T
Bought by
Cabral Emily J
Current Estimated Value
Purchase Details
Closed on
Aug 29, 2012
Sold by
Fontes Jose A
Bought by
Jose A Fontes T A and Jose Medeiros
Purchase Details
Closed on
May 2, 1969
Bought by
Jose A Fontes T
Create a Home Valuation Report for This Property
The Home Valuation Report is an in-depth analysis detailing your home's value as well as a comparison with similar homes in the area
Home Values in the Area
Average Home Value in this Area
Purchase History
| Date | Buyer | Sale Price | Title Company |
|---|---|---|---|
| Cabral Emily J | $190,000 | -- | |
| Cabral Emily J | $190,000 | -- | |
| Jose A Fontes T A | -- | -- | |
| Jose A Fontes T | -- | -- | |
| Jose A Fontes T | -- | -- |
Source: Public Records
Mortgage History
| Date | Status | Borrower | Loan Amount |
|---|---|---|---|
| Previous Owner | Jose A Fontes T | $74,000 |
Source: Public Records
Tax History Compared to Growth
Tax History
| Year | Tax Paid | Tax Assessment Tax Assessment Total Assessment is a certain percentage of the fair market value that is determined by local assessors to be the total taxable value of land and additions on the property. | Land | Improvement |
|---|---|---|---|---|
| 2025 | $6,034 | $434,700 | $163,500 | $271,200 |
| 2024 | $5,620 | $401,400 | $148,500 | $252,900 |
| 2023 | $5,779 | $395,800 | $142,900 | $252,900 |
| 2022 | $5,063 | $319,200 | $129,800 | $189,400 |
| 2021 | $4,793 | $288,900 | $123,700 | $165,200 |
| 2020 | $4,528 | $272,600 | $121,300 | $151,300 |
| 2019 | $15,814 | $268,800 | $121,300 | $147,500 |
| 2018 | $4,491 | $256,600 | $115,400 | $141,200 |
| 2017 | $4,064 | $232,200 | $109,900 | $122,300 |
| 2016 | $3,645 | $210,800 | $109,900 | $100,900 |
| 2015 | $3,646 | $211,100 | $109,900 | $101,200 |
| 2014 | $3,470 | $199,200 | $96,400 | $102,800 |
Source: Public Records
Map
Nearby Homes
- 248 Main St Unit 207
- 248 Main St Unit 216
- 16 Houghton St
- 11 Barracks Rd Unit 11
- 9 Barracks Rd Unit 9
- 3 Barracks Rd Unit 3
- 7 Barracks Rd Unit 7
- 5 Barracks Rd Unit 5
- 34 Forest Ave
- 65 Main St
- 56 Forest Ave
- 17 School St Unit C
- 17 School St Unit A
- 18-24 River St Unit 1
- 107 Washington St
- 56 Park St
- 74 Cox St Unit 9
- 4 Linden St
- 55 Cottage St
- 26 Marychris Dr