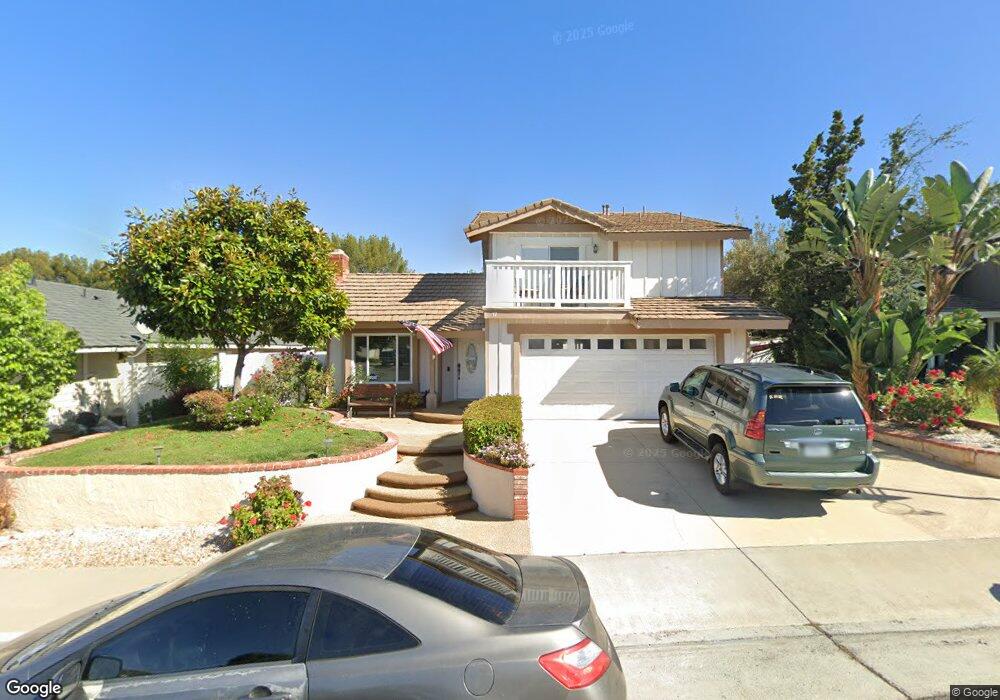
17 Los Pioneros Rancho Santa Margarita, CA 92688
Estimated Value: $1,068,448 - $1,198,000
3
Beds
3
Baths
1,602
Sq Ft
$696/Sq Ft
Est. Value
About This Home
This home is located at 17 Los Pioneros, Rancho Santa Margarita, CA 92688 and is currently estimated at $1,114,862, approximately $695 per square foot. 17 Los Pioneros is a home located in Orange County with nearby schools including Trabuco Mesa Elementary School, Rancho Santa Margarita Intermediate School, and Trabuco Hills High School.
Ownership History
Date
Name
Owned For
Owner Type
Purchase Details
Closed on
Aug 20, 2014
Sold by
Idrisi Nabeel and Idrisi Jenan
Bought by
Idrisi Family Revocable Trust
Current Estimated Value
Purchase Details
Closed on
Sep 9, 2002
Sold by
Idrisi Nizar A
Bought by
Idrisi Nabeel and Idrisi Jenan
Home Financials for this Owner
Home Financials are based on the most recent Mortgage that was taken out on this home.
Original Mortgage
$288,000
Outstanding Balance
$115,998
Interest Rate
5.75%
Mortgage Type
Negative Amortization
Estimated Equity
$998,864
Purchase Details
Closed on
Apr 4, 1996
Sold by
Taylor Thomas and Taylor Nancy
Bought by
Idrisi Nizar A
Home Financials for this Owner
Home Financials are based on the most recent Mortgage that was taken out on this home.
Original Mortgage
$157,300
Interest Rate
7.97%
Create a Home Valuation Report for This Property
The Home Valuation Report is an in-depth analysis detailing your home's value as well as a comparison with similar homes in the area
Home Values in the Area
Average Home Value in this Area
Purchase History
| Date | Buyer | Sale Price | Title Company |
|---|---|---|---|
| Idrisi Family Revocable Trust | -- | None Available | |
| Idrisi Nabeel | -- | Stewart Title | |
| Idrisi Nizar A | $175,000 | Fidelity National Title Ins |
Source: Public Records
Mortgage History
| Date | Status | Borrower | Loan Amount |
|---|---|---|---|
| Open | Idrisi Nabeel | $288,000 | |
| Previous Owner | Idrisi Nizar A | $157,300 |
Source: Public Records
Tax History Compared to Growth
Tax History
| Year | Tax Paid | Tax Assessment Tax Assessment Total Assessment is a certain percentage of the fair market value that is determined by local assessors to be the total taxable value of land and additions on the property. | Land | Improvement |
|---|---|---|---|---|
| 2025 | $5,759 | $568,710 | $377,192 | $191,518 |
| 2024 | $5,759 | $557,559 | $369,796 | $187,763 |
| 2023 | $5,626 | $546,627 | $362,545 | $184,082 |
| 2022 | $5,530 | $535,909 | $355,436 | $180,473 |
| 2021 | $4,692 | $525,401 | $348,466 | $176,935 |
| 2020 | $5,382 | $520,014 | $344,893 | $175,121 |
| 2019 | $5,971 | $509,818 | $338,130 | $171,688 |
| 2018 | $5,882 | $499,822 | $331,500 | $168,322 |
| 2017 | $5,948 | $490,022 | $325,000 | $165,022 |
| 2016 | $6,381 | $480,414 | $318,627 | $161,787 |
| 2015 | $6,539 | $473,198 | $313,841 | $159,357 |
| 2014 | $6,485 | $463,929 | $307,693 | $156,236 |
Source: Public Records
Map
Nearby Homes
- 1 El Canto
- 4 Raposa
- 25 Dewberry
- 16 Las Piedras
- 31 Gaviota Unit 136
- 73 Gaviota
- 4 Pica Flor Unit 54
- 54 Gavilan
- 70 Gavilan Unit 18
- 21 Silktassel
- 28 Montana Del Lago Dr Unit 159
- 15 Temecula Ct
- 231 Montana Del Lago Dr Unit 22
- 225 Montana Del Lago Dr
- 250 Montana Del Lago Dr
- 34 Dianthus
- 31 Brisa Del Lago
- 21 Lobelia
- 1 Brisa Del Lago
- 12 El Vaquero
- 15 Los Pioneros
- 19 Los Pioneros
- 13 Los Pioneros
- 21 Los Pioneros
- 2 Las Alforjas
- 5 Calle Ranchera
- 1 Las Alforjas
- 11 Los Pioneros
- 4 Las Alforjas
- 23 Los Pioneros
- 3 Las Alforjas
- 7 Calle Ranchera
- 6 Las Alforjas
- 2 Via Jaquima
- 9 Los Pioneros
- 2 Calle Ranchera
- 5 Las Alforjas
- 4 Via Jaquima
- 4 Calle Ranchera
- 9 Calle Ranchera