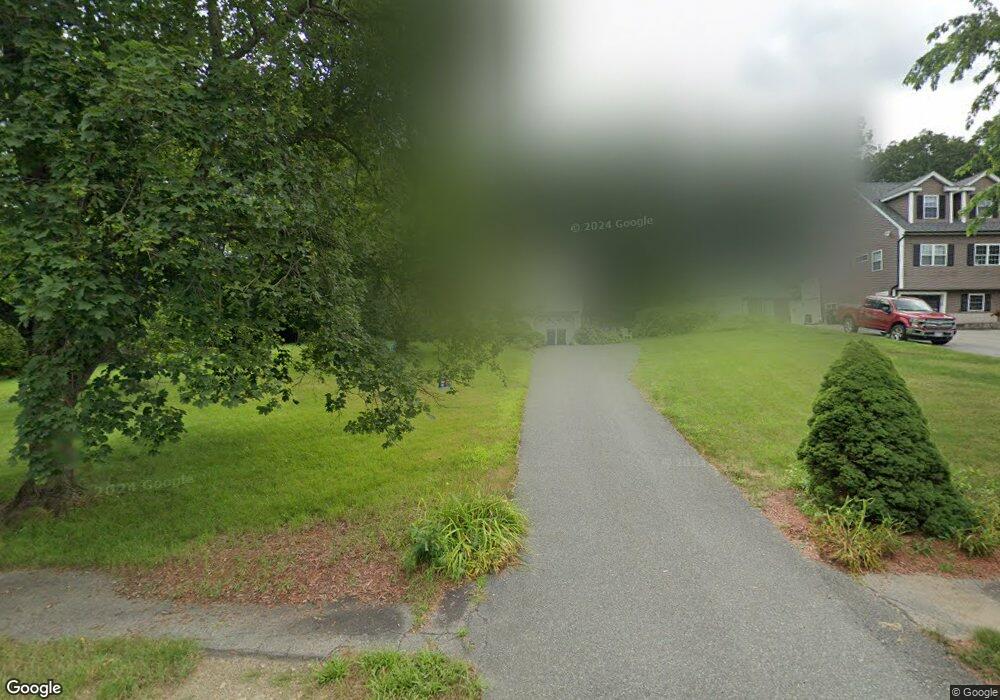
17 Lucaya Cir Wilmington, MA 01887
Estimated Value: $704,000 - $840,000
3
Beds
2
Baths
1,080
Sq Ft
$710/Sq Ft
Est. Value
About This Home
This home is located at 17 Lucaya Cir, Wilmington, MA 01887 and is currently estimated at $766,411, approximately $709 per square foot. 17 Lucaya Cir is a home located in Middlesex County with nearby schools including Wilmington Middle School, Wilmington High School, and N Reading Knowledge Beginnings.
Ownership History
Date
Name
Owned For
Owner Type
Purchase Details
Closed on
May 2, 2000
Sold by
Kenney Catherine M and Kenney Walter P
Bought by
Kane Brian P
Current Estimated Value
Home Financials for this Owner
Home Financials are based on the most recent Mortgage that was taken out on this home.
Original Mortgage
$180,000
Interest Rate
8.23%
Mortgage Type
Purchase Money Mortgage
Create a Home Valuation Report for This Property
The Home Valuation Report is an in-depth analysis detailing your home's value as well as a comparison with similar homes in the area
Home Values in the Area
Average Home Value in this Area
Purchase History
| Date | Buyer | Sale Price | Title Company |
|---|---|---|---|
| Kane Brian P | $240,000 | -- |
Source: Public Records
Mortgage History
| Date | Status | Borrower | Loan Amount |
|---|---|---|---|
| Open | Kane Brian P | $190,000 | |
| Closed | Kane Brian P | $180,000 | |
| Previous Owner | Kane Brian P | $45,000 |
Source: Public Records
Tax History Compared to Growth
Tax History
| Year | Tax Paid | Tax Assessment Tax Assessment Total Assessment is a certain percentage of the fair market value that is determined by local assessors to be the total taxable value of land and additions on the property. | Land | Improvement |
|---|---|---|---|---|
| 2025 | $7,811 | $682,200 | $339,100 | $343,100 |
| 2024 | $7,744 | $677,500 | $339,100 | $338,400 |
| 2023 | $7,233 | $605,800 | $287,800 | $318,000 |
| 2022 | $6,876 | $527,700 | $239,700 | $288,000 |
| 2021 | $6,753 | $487,900 | $217,900 | $270,000 |
| 2020 | $6,812 | $501,600 | $217,900 | $283,700 |
| 2019 | $6,357 | $462,300 | $213,000 | $249,300 |
| 2018 | $5,973 | $414,500 | $202,900 | $211,600 |
| 2017 | $5,875 | $406,600 | $202,900 | $203,700 |
| 2016 | $5,577 | $381,200 | $193,400 | $187,800 |
| 2015 | $5,376 | $374,100 | $193,400 | $180,700 |
| 2014 | $5,058 | $355,200 | $184,200 | $171,000 |
Source: Public Records
Map
Nearby Homes
- 220 Martins Landing Unit 309
- 260 Martins Landing Unit 508
- 260 Martins Landing Unit 103
- 200 Martins Landing Unit 102
- 3 Gordon Rd
- 320 Martins Landing Unit 311
- 320 Martins Landing Unit 108
- 320 Martins Landing Unit 109
- 320 Martins Landing Unit 110
- 320 Martins Landing Unit 303
- 320 Martins Landing Unit 102
- 320 Martins Landing Unit 103
- 320 Martins Landing Unit 2410
- 320 Martins Landing Unit 403
- 320 Martins Landing Unit 107
- 320 Martins Landing Unit 210
- 320 Martins Landing Unit 2201
- 320 Martins Landing Unit 112
- 320 Martins Landing Unit 206
- 320 Martins Landing Unit 2307