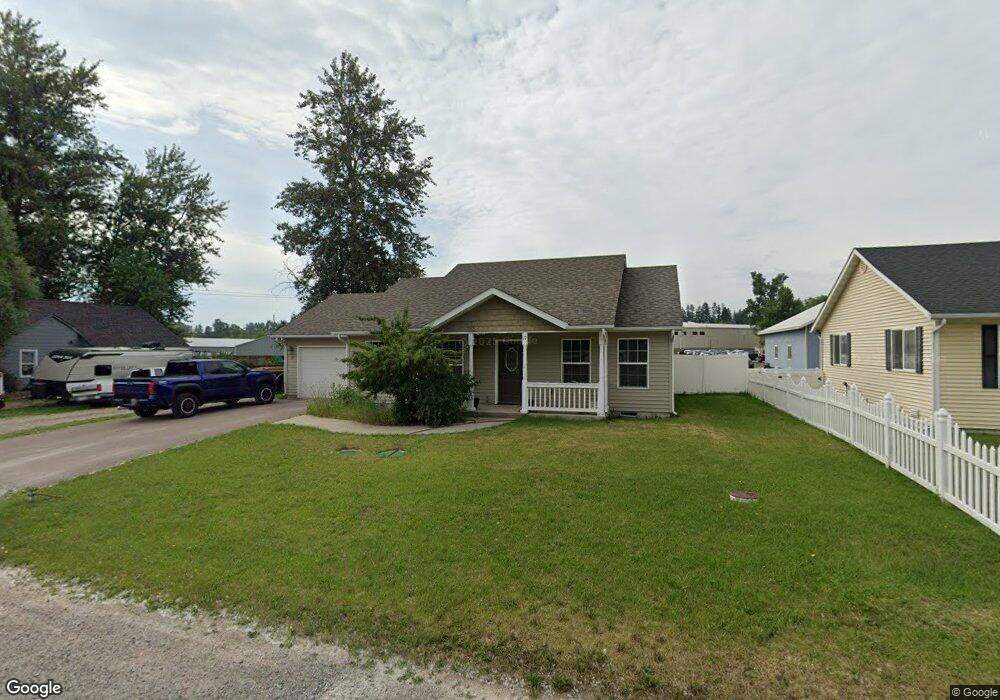
17 Magstadt Ln Kalispell, MT 59901
Estimated Value: $305,000 - $451,000
2
Beds
2
Baths
1,080
Sq Ft
$355/Sq Ft
Est. Value
About This Home
This home is located at 17 Magstadt Ln, Kalispell, MT 59901 and is currently estimated at $383,188, approximately $354 per square foot. 17 Magstadt Ln is a home located in Flathead County with nearby schools including Edgerton School, Kalispell Middle School, and Glacier High School.
Ownership History
Date
Name
Owned For
Owner Type
Purchase Details
Closed on
Aug 25, 2021
Sold by
Storr Kelsey A
Bought by
Storr April D
Current Estimated Value
Home Financials for this Owner
Home Financials are based on the most recent Mortgage that was taken out on this home.
Original Mortgage
$230,000
Outstanding Balance
$209,283
Interest Rate
2.8%
Mortgage Type
New Conventional
Estimated Equity
$173,905
Purchase Details
Closed on
Jul 7, 2008
Sold by
James Lee Construction Inc
Bought by
Storr Kelsey A and Storr April D
Home Financials for this Owner
Home Financials are based on the most recent Mortgage that was taken out on this home.
Original Mortgage
$168,758
Interest Rate
6%
Mortgage Type
New Conventional
Purchase Details
Closed on
Oct 9, 2007
Sold by
Brabham Joseph A and Brabham Paulina G
Bought by
James Lee Construction Inc
Purchase Details
Closed on
Feb 24, 2006
Sold by
Brabham Joseph A and Brabham Paulina G
Bought by
James Lee Construction Inc
Create a Home Valuation Report for This Property
The Home Valuation Report is an in-depth analysis detailing your home's value as well as a comparison with similar homes in the area
Home Values in the Area
Average Home Value in this Area
Purchase History
| Date | Buyer | Sale Price | Title Company |
|---|---|---|---|
| Storr April D | -- | Fidelity National Title | |
| Storr Kelsey A | -- | First American Title Company | |
| James Lee Construction Inc | -- | Citizens Title & Escrow Comp | |
| James Lee Construction Inc | -- | Citizens Title & Escrow Comp |
Source: Public Records
Mortgage History
| Date | Status | Borrower | Loan Amount |
|---|---|---|---|
| Open | Storr April D | $230,000 | |
| Closed | Storr Kelsey A | $168,758 |
Source: Public Records
Tax History Compared to Growth
Tax History
| Year | Tax Paid | Tax Assessment Tax Assessment Total Assessment is a certain percentage of the fair market value that is determined by local assessors to be the total taxable value of land and additions on the property. | Land | Improvement |
|---|---|---|---|---|
| 2025 | $1,647 | $396,100 | $0 | $0 |
| 2024 | $2,349 | $340,000 | $0 | $0 |
| 2023 | $2,383 | $340,000 | $0 | $0 |
| 2022 | $2,191 | $245,000 | $0 | $0 |
| 2021 | $2,295 | $245,000 | $0 | $0 |
| 2020 | $1,905 | $194,300 | $0 | $0 |
| 2019 | $1,900 | $194,300 | $0 | $0 |
| 2018 | $1,641 | $165,200 | $0 | $0 |
| 2017 | $1,650 | $165,200 | $0 | $0 |
| 2016 | $1,433 | $157,600 | $0 | $0 |
| 2015 | $1,453 | $157,600 | $0 | $0 |
| 2014 | $1,487 | $97,202 | $0 | $0 |
Source: Public Records
Map
Nearby Homes
- 2031 River Place
- 1000 Rail Park Dr
- 14 A, 11 AE River Rd
- 276 Somerset Dr
- 100 Woodlands Way Unit P-204
- 100 Woodlands Way Unit W-308
- 100 Woodlands Way Unit W-304
- 100 Woodlands Way Unit W-302
- 100 Woodlands Way Unit W-408
- 100 Woodlands Way Unit P-307
- 154 Riverside Dr
- 1100 E Oregon St Unit 13
- 847 E Washington St
- 39 Park St
- 712 Conrad Dr
- 871 Conrad Dr
- 486 7th Ave W
- 11 W Cottonwood Dr
- 63 / 65 Tahoe Dr
- 278 7th Ave W
- 15 Magstadt Ln
- 19 Magstadt Ln
- NHN Magstadt Ln
- 20 Magstadt Ln
- 21 Magstadt Ln
- 24 Magstadt Ln
- 25 Magstadt Ln
- 28 Magstadt Ln
- 28 Magstadt Ln
- 95 Nicholson Dr
- 131 Nicholson Dr
- 16 Magstadt Ln
- 32 Magstadt Ln
- 281 Montclair Dr
- 85 Nicholson Dr
- 139 Nicholson Dr
- 194 Nicholson Dr
- 315 Montclair Dr
- 319 Montclair Dr
- 275 Montclair Dr