
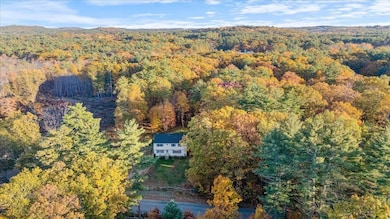
17 Maple Ave Newton, NH 03858
Estimated payment $3,411/month
Highlights
- Wooded Lot
- Den
- Water Purifier
- Garrison Architecture
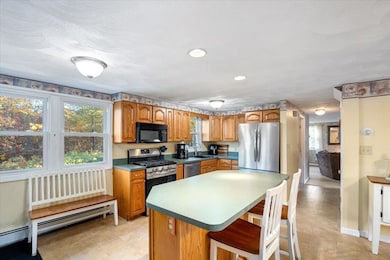
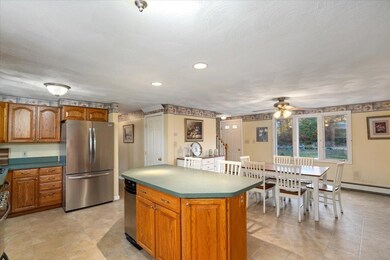
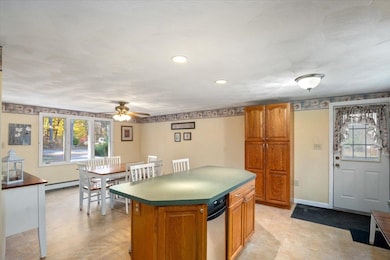
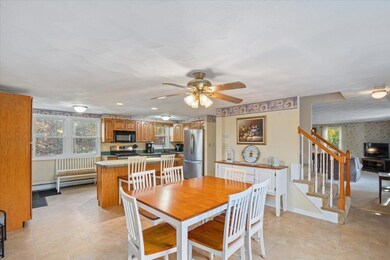
- Kitchen Island
- Combination Kitchen and Dining Room
About This Home
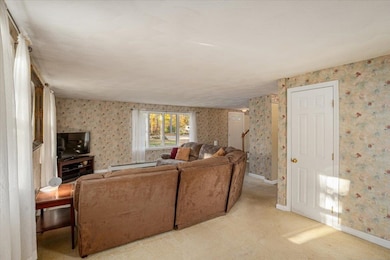
Set back from the street on 2.2 acres, this inviting country-style home in Newton offers privacy, space, and opportunity. The first floor features a functional, open-concept kitchen and dining area. A generous sized living room provides plenty of space for gathering with family or entertaining guests, while a first-floor half bath with laundry adds practical ease. Upstairs includes three bedrooms and an office, offering flexibility for work or additional living space. The large primary bedroom presents the potential modify to create a three-quarter or full bath where there is currently a jetted tub. New 50 yr roof w/transferable warranty, propane heat 5 yrs old, updated electrical panel. Well-maintained and thoughtfully laid out, this home is ready for your updates and finishing touches. Surrounded by mature trees and open space, the property offers a peaceful setting just minutes from local shops, schools, and commuter routes. Enjoy this perfect balance of rural charm and accessibility. Offer deadline Tuesday 11/28 11am
Listing Agent
Aluxety Brokerage Phone: 978-884-5609 License #068063 Listed on: 10/22/2025

Home Details
Home Type
- Single Family
Est. Annual Taxes
- $7,725
Year Built
- Built in 1972
Lot Details
- 2.2 Acre Lot
- Property fronts a private road
- Level Lot
- Wooded Lot
- Property is zoned RES-A
Parking
- Gravel Driveway
Home Design
- Garrison Architecture
- Vinyl Siding
Interior Spaces
- Property has 2 Levels
- Combination Kitchen and Dining Room
- Den
Kitchen
- Gas Range
- Microwave
- Dishwasher
- Kitchen Island
Flooring
- Carpet
- Vinyl
Bedrooms and Bathrooms
- 3 Bedrooms
- En-Suite Bathroom
Laundry
- Dryer
- Washer
Basement
- Walk-Up Access
- Interior Basement Entry
Utilities
- Baseboard Heating
- Hot Water Heating System
- Private Water Source
- Drilled Well
- Water Purifier
- Septic Tank
- Cable TV Available
Listing and Financial Details
- Legal Lot and Block 8 / 7
- Assessor Parcel Number 10
Map
Home Values in the Area
Average Home Value in this Area
Tax History
| Year | Tax Paid | Tax Assessment Tax Assessment Total Assessment is a certain percentage of the fair market value that is determined by local assessors to be the total taxable value of land and additions on the property. | Land | Improvement |
|---|---|---|---|---|
| 2024 | $7,725 | $304,500 | $122,500 | $182,000 |
| 2023 | $7,494 | $304,500 | $122,500 | $182,000 |
| 2022 | $6,848 | $304,500 | $122,500 | $182,000 |
| 2021 | $6,364 | $304,500 | $122,500 | $182,000 |
| 2020 | $6,364 | $304,500 | $122,500 | $182,000 |
| 2019 | $6,653 | $252,200 | $87,900 | $164,300 |
| 2018 | $6,451 | $252,200 | $87,900 | $164,300 |
| 2017 | $6,703 | $252,200 | $87,900 | $164,300 |
| 2016 | $6,598 | $252,200 | $87,900 | $164,300 |
| 2015 | $6,600 | $252,200 | $87,900 | $164,300 |
| 2014 | $6,449 | $248,600 | $96,400 | $152,200 |
| 2013 | $6,290 | $248,600 | $96,400 | $152,200 |
Property History
| Date | Event | Price | List to Sale | Price per Sq Ft |
|---|---|---|---|---|
| 10/22/2025 10/22/25 | For Sale | $524,900 | -- | $268 / Sq Ft |
Purchase History
| Date | Type | Sale Price | Title Company |
|---|---|---|---|
| Quit Claim Deed | -- | None Available | |
| Quit Claim Deed | -- | None Available | |
| Quit Claim Deed | -- | None Available | |
| Quit Claim Deed | -- | None Available | |
| Warranty Deed | $110,000 | -- | |
| Warranty Deed | $110,000 | -- |
Mortgage History
| Date | Status | Loan Amount | Loan Type |
|---|---|---|---|
| Previous Owner | $340,000 | Stand Alone Refi Refinance Of Original Loan | |
| Previous Owner | $271,200 | Stand Alone Refi Refinance Of Original Loan | |
| Previous Owner | $34,000 | Unknown | |
| Previous Owner | $288,000 | Unknown |
Source: PrimeMLS
MLS Number: 5066880
APN: NWTO-000010-000007-000008
Disclaimer: Certain information contained herein is derived from information provided by parties other than Homes.com. All information provided is deemed reliable, but is not guaranteed to be accurate and should be independently verified.
![]() Copyright 2025 PrimeMLS, Inc. All rights reserved. This information is deemed reliable, but not guaranteed. The data relating to real estate displayed on this display comes in part from the IDX Program of PrimeMLS. The information being provided is for consumers’ personal, non-commercial use and may not be used for any purpose other than to identify prospective properties consumers may be interested in purchasing.
Copyright 2025 PrimeMLS, Inc. All rights reserved. This information is deemed reliable, but not guaranteed. The data relating to real estate displayed on this display comes in part from the IDX Program of PrimeMLS. The information being provided is for consumers’ personal, non-commercial use and may not be used for any purpose other than to identify prospective properties consumers may be interested in purchasing.
- 157 Chase Rd
- 20 Ordway Ln
- 21 Mason Ct Unit 21
- 18 Mason Ct Unit 18
- 1 Regency Village Way
- 1 Regency Village Way Unit 316
- 2 Regency Village Way Unit 208
- 100 Whitehall Rd
- 41 High St Unit 6
- 83.5 Market St Unit 83.5
- 131 Main St Unit 2F
- 177 Main St Unit A
- 36 Haverhill Rd
- 13 Aubin St
- 13 Aubin St
- 10 Fruit Place Unit 3
- 1 Cedar Ct Unit 3
- 104 Elm St Unit 104 Elm St. Unit A
- 107.5 Elm St
- 112 Elm St