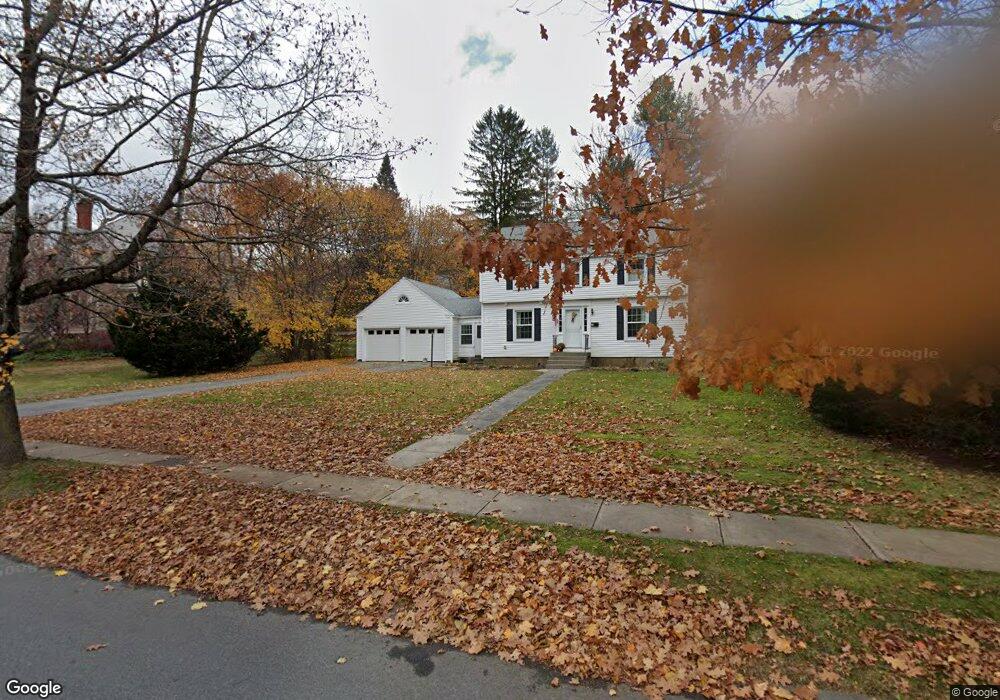
17 Maple St Shelburne Falls, MA 01370
Estimated Value: $404,524 - $469,000
3
Beds
2
Baths
1,666
Sq Ft
$267/Sq Ft
Est. Value
About This Home
This home is located at 17 Maple St, Shelburne Falls, MA 01370 and is currently estimated at $444,131, approximately $266 per square foot. 17 Maple St is a home located in Franklin County with nearby schools including Mohawk Trail Regional High School.
Ownership History
Date
Name
Owned For
Owner Type
Purchase Details
Closed on
Aug 15, 2022
Sold by
Johnston Norbert B and Johnston Doris L
Bought by
Johnston Int and Johnston J
Current Estimated Value
Home Financials for this Owner
Home Financials are based on the most recent Mortgage that was taken out on this home.
Original Mortgage
$252,500
Interest Rate
5.25%
Mortgage Type
Purchase Money Mortgage
Purchase Details
Closed on
Jun 23, 2022
Sold by
Gavin L Kelvin L and Gavin Joann M
Bought by
Johnston Norbert B and Johnston Doris L
Home Financials for this Owner
Home Financials are based on the most recent Mortgage that was taken out on this home.
Original Mortgage
$252,500
Interest Rate
5.25%
Mortgage Type
Purchase Money Mortgage
Purchase Details
Closed on
Sep 17, 2009
Sold by
Gavin L Kelvin
Bought by
Gavin L Kelvin L and Gavin Joann M
Create a Home Valuation Report for This Property
The Home Valuation Report is an in-depth analysis detailing your home's value as well as a comparison with similar homes in the area
Home Values in the Area
Average Home Value in this Area
Purchase History
| Date | Buyer | Sale Price | Title Company |
|---|---|---|---|
| Johnston Int | -- | None Available | |
| Johnston Int | -- | None Available | |
| Johnston Norbert B | $352,500 | None Available | |
| Johnston Norbert B | $352,500 | None Available | |
| Gavin L Kelvin L | -- | -- | |
| Gavin L Kelvin L | -- | -- |
Source: Public Records
Mortgage History
| Date | Status | Borrower | Loan Amount |
|---|---|---|---|
| Previous Owner | Johnston Norbert B | $252,500 |
Source: Public Records
Tax History
| Year | Tax Paid | Tax Assessment Tax Assessment Total Assessment is a certain percentage of the fair market value that is determined by local assessors to be the total taxable value of land and additions on the property. | Land | Improvement |
|---|---|---|---|---|
| 2025 | $3,957 | $308,200 | $86,300 | $221,900 |
| 2024 | $3,978 | $300,000 | $86,300 | $213,700 |
| 2023 | $4,095 | $300,000 | $86,300 | $213,700 |
| 2022 | $3,365 | $232,200 | $86,300 | $145,900 |
| 2021 | $3,078 | $212,700 | $78,500 | $134,200 |
| 2020 | $3,078 | $220,200 | $82,400 | $137,800 |
| 2019 | $2,786 | $193,600 | $78,500 | $115,100 |
| 2018 | $2,785 | $176,700 | $65,900 | $110,800 |
| 2017 | $2,624 | $176,700 | $65,900 | $110,800 |
| 2015 | $2,461 | $177,200 | $68,300 | $108,900 |
| 2014 | $2,413 | $177,200 | $68,300 | $108,900 |
Source: Public Records
Map
Nearby Homes
- 10 Deerfield Ave Unit 2
- 13 Bray Rd
- 102 Elm St
- 2151 Route 2
- 2155 Massachusetts 2
- 143 E Buckland Rd
- 7 Hog Hollow Rd
- 31 W Oxbow Rd
- 24 W Oxbow Rd
- 0 Upper St
- 0 W Oxbow Rd Unit 73453651
- 0 W Oxbow Rd Unit 248444
- 1451 Massachusetts 2
- 1451 Route 2 E
- 85 Dacey Rd
- 5 Clesson Brook Rd
- lot 1 Shelburne Falls Rd
- 240 Beldingville Rd
- 414 Mohawk Trail
- 151 Smead Hill Rd
Your Personal Tour Guide
Ask me questions while you tour the home.