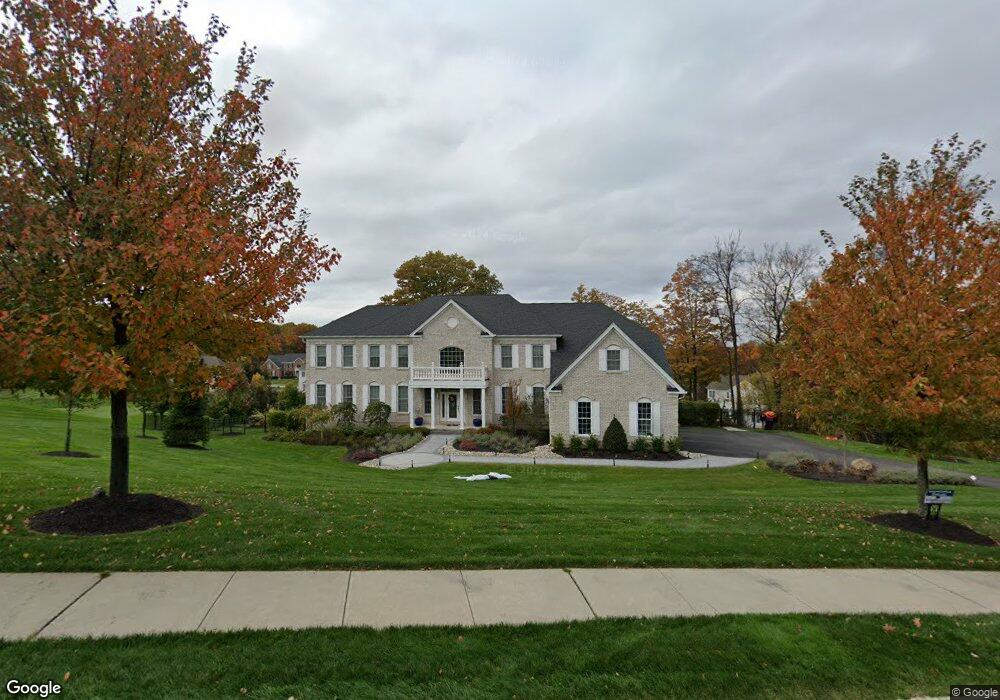
17 Marcin Way Flanders, NJ 07836
Estimated Value: $1,256,000 - $1,392,000
--
Bed
--
Bath
6,309
Sq Ft
$208/Sq Ft
Est. Value
About This Home
This home is located at 17 Marcin Way, Flanders, NJ 07836 and is currently estimated at $1,314,530, approximately $208 per square foot. 17 Marcin Way is a home with nearby schools including Mt Olive Middle School and Mount Olive High School.
Ownership History
Date
Name
Owned For
Owner Type
Purchase Details
Closed on
May 30, 2014
Sold by
Toll Nj One Llc
Bought by
Pourreza Shahriar and Pourreza Alichia
Current Estimated Value
Create a Home Valuation Report for This Property
The Home Valuation Report is an in-depth analysis detailing your home's value as well as a comparison with similar homes in the area
Home Values in the Area
Average Home Value in this Area
Purchase History
| Date | Buyer | Sale Price | Title Company |
|---|---|---|---|
| Pourreza Shahriar | $939,890 | -- |
Source: Public Records
Tax History Compared to Growth
Tax History
| Year | Tax Paid | Tax Assessment Tax Assessment Total Assessment is a certain percentage of the fair market value that is determined by local assessors to be the total taxable value of land and additions on the property. | Land | Improvement |
|---|---|---|---|---|
| 2025 | $28,225 | $809,900 | $158,300 | $651,600 |
| 2024 | $26,621 | $809,900 | $158,300 | $651,600 |
| 2023 | $26,621 | $809,900 | $158,300 | $651,600 |
| 2022 | $27,196 | $809,900 | $158,300 | $651,600 |
| 2021 | $27,196 | $809,900 | $158,300 | $651,600 |
| 2020 | $26,832 | $809,900 | $158,300 | $651,600 |
| 2019 | $26,743 | $809,900 | $158,300 | $651,600 |
| 2018 | $25,365 | $775,700 | $158,300 | $617,400 |
| 2017 | $24,923 | $775,700 | $158,300 | $617,400 |
| 2016 | $24,132 | $775,700 | $158,300 | $617,400 |
| 2015 | $24,698 | $775,700 | $158,300 | $617,400 |
| 2014 | $24,645 | $79,100 | $79,100 | $0 |
Source: Public Records
Map
Nearby Homes
- 8 Stark Ct
- 5 Fennimore Ct
- 139 Flanders Netcong Rd
- 17 Scarborough Ct
- 11 Southwind Dr
- 81 Clinton Ave
- 38 Crestwood Cir
- 1 Kenneth Terrace
- 48 Old Budd Lake Rd
- 16 Old Ledgewood Rd
- 5 New St
- 21 Mount Olive Rd
- 11 Church St
- 15 Amos Way
- 19 Amos Way
- 9 Anderson Place
- 25 Budd Ave
- 35 Forest Rd
- 1 Pershing Ave
- 4 Spring St