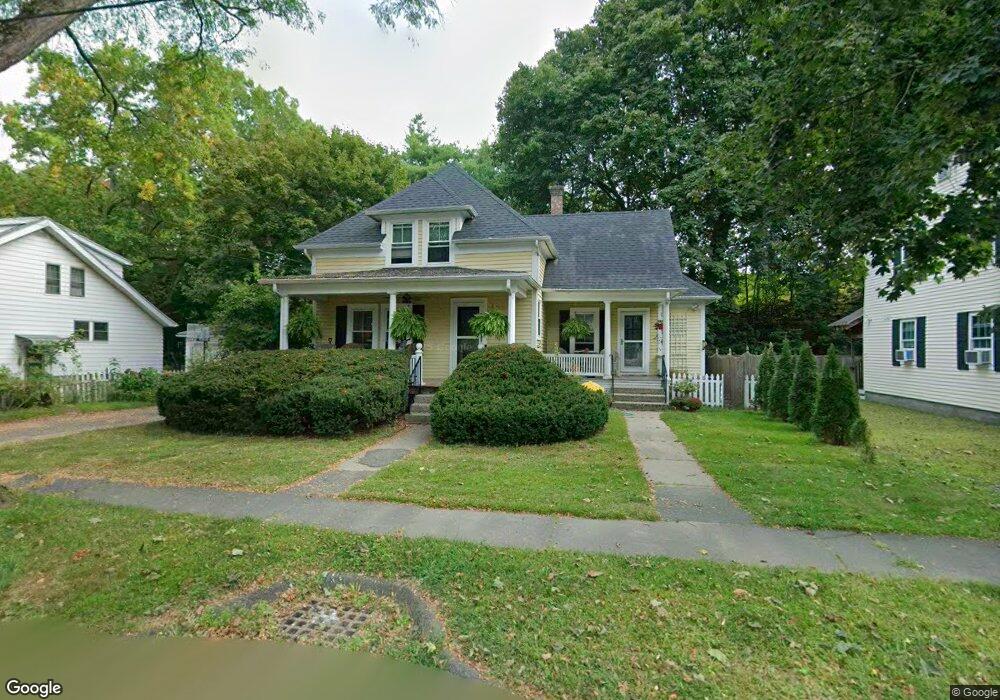
17 Marshall St Northampton, MA 01060
Estimated Value: $370,142 - $447,000
3
Beds
1
Bath
1,253
Sq Ft
$331/Sq Ft
Est. Value
About This Home
This home is located at 17 Marshall St, Northampton, MA 01060 and is currently estimated at $415,286, approximately $331 per square foot. 17 Marshall St is a home located in Hampshire County with nearby schools including Northampton High School and The Montessori School of Northampton.
Ownership History
Date
Name
Owned For
Owner Type
Purchase Details
Closed on
May 4, 1994
Sold by
Gill Mindy
Bought by
Sheldon Randy J
Current Estimated Value
Home Financials for this Owner
Home Financials are based on the most recent Mortgage that was taken out on this home.
Original Mortgage
$103,783
Interest Rate
7.7%
Mortgage Type
Purchase Money Mortgage
Create a Home Valuation Report for This Property
The Home Valuation Report is an in-depth analysis detailing your home's value as well as a comparison with similar homes in the area
Home Values in the Area
Average Home Value in this Area
Purchase History
| Date | Buyer | Sale Price | Title Company |
|---|---|---|---|
| Sheldon Randy J | $105,000 | -- |
Source: Public Records
Mortgage History
| Date | Status | Borrower | Loan Amount |
|---|---|---|---|
| Open | Sheldon Randy J | $79,500 | |
| Closed | Sheldon Randy J | $97,500 | |
| Closed | Sheldon Randy J | $103,783 |
Source: Public Records
Tax History
| Year | Tax Paid | Tax Assessment Tax Assessment Total Assessment is a certain percentage of the fair market value that is determined by local assessors to be the total taxable value of land and additions on the property. | Land | Improvement |
|---|---|---|---|---|
| 2025 | $4,647 | $333,600 | $123,900 | $209,700 |
| 2024 | $4,113 | $270,800 | $142,000 | $128,800 |
| 2023 | $4,304 | $271,700 | $129,000 | $142,700 |
| 2022 | $4,390 | $245,400 | $120,600 | $124,800 |
| 2021 | $3,875 | $223,100 | $115,000 | $108,100 |
| 2020 | $3,748 | $223,100 | $115,000 | $108,100 |
| 2019 | $3,728 | $214,600 | $115,000 | $99,600 |
| 2018 | $3,463 | $203,200 | $115,000 | $88,200 |
| 2017 | $3,391 | $203,200 | $115,000 | $88,200 |
| 2016 | $3,284 | $203,200 | $115,000 | $88,200 |
| 2015 | $3,386 | $214,300 | $107,500 | $106,800 |
| 2014 | $3,298 | $214,300 | $107,500 | $106,800 |
Source: Public Records
Map
Nearby Homes
- 35 Hubbard Ave
- 22 Woodbine Ave
- 20 View Ave Unit A
- 30 View Ave
- 50 Union St Unit 18
- 13A Finn St
- 25 Union St
- 25 Union St Unit 2
- 30 Graves Ave Unit B
- 10 Hawley St Unit 4C
- 10 Hawley St Unit 4D
- 10 Hawley St Unit 1C
- 10 Hawley St Unit 4B
- 10 Hawley St Unit 4A
- 26 Russell St Unit A-B
- 37 Finn St
- 80 Damon Rd Unit 5104
- 80 Damon Rd Unit 4302
- 61 Crescent St Unit 8
- 61 Crescent St Unit 7
Your Personal Tour Guide
Ask me questions while you tour the home.