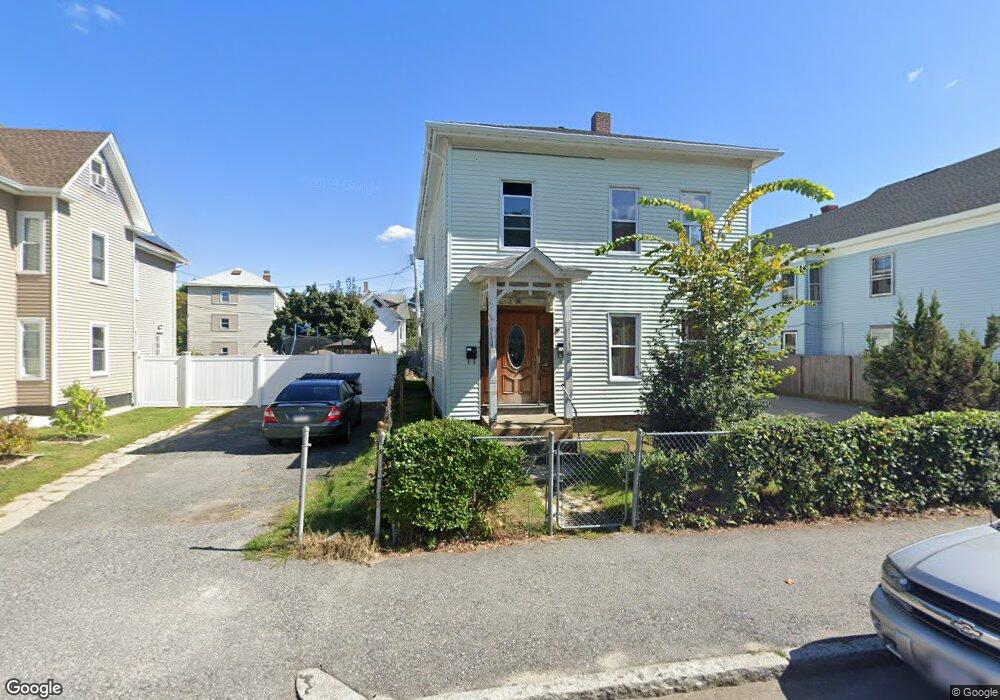
17 Mason St Unit 2 Worcester, MA 01609
Elm Park NeighborhoodEstimated Value: $483,108 - $662,000
4
Beds
1
Bath
1,200
Sq Ft
$479/Sq Ft
Est. Value
About This Home
This home is located at 17 Mason St Unit 2, Worcester, MA 01609 and is currently estimated at $575,027, approximately $479 per square foot. 17 Mason St Unit 2 is a home located in Worcester County with nearby schools including Jacob Hiatt Magnet School, Chandler Magnet, and Elm Park Elementary School.
Ownership History
Date
Name
Owned For
Owner Type
Purchase Details
Closed on
Dec 22, 2006
Sold by
Irula Blas O and Irula Concepcion E
Bought by
Soko Benjamin and Soko Lorpu
Current Estimated Value
Home Financials for this Owner
Home Financials are based on the most recent Mortgage that was taken out on this home.
Original Mortgage
$208,500
Outstanding Balance
$124,934
Interest Rate
6.35%
Mortgage Type
Purchase Money Mortgage
Estimated Equity
$450,093
Create a Home Valuation Report for This Property
The Home Valuation Report is an in-depth analysis detailing your home's value as well as a comparison with similar homes in the area
Home Values in the Area
Average Home Value in this Area
Purchase History
| Date | Buyer | Sale Price | Title Company |
|---|---|---|---|
| Soko Benjamin | $208,500 | -- |
Source: Public Records
Mortgage History
| Date | Status | Borrower | Loan Amount |
|---|---|---|---|
| Open | Soko Benjamin | $208,500 |
Source: Public Records
Tax History Compared to Growth
Tax History
| Year | Tax Paid | Tax Assessment Tax Assessment Total Assessment is a certain percentage of the fair market value that is determined by local assessors to be the total taxable value of land and additions on the property. | Land | Improvement |
|---|---|---|---|---|
| 2025 | $5,735 | $434,800 | $72,500 | $362,300 |
| 2024 | $5,426 | $394,600 | $72,500 | $322,100 |
| 2023 | $5,009 | $349,300 | $58,200 | $291,100 |
| 2022 | $4,636 | $304,800 | $46,600 | $258,200 |
| 2021 | $4,256 | $261,400 | $37,200 | $224,200 |
| 2020 | $3,964 | $233,200 | $37,400 | $195,800 |
| 2019 | $4,050 | $225,000 | $36,800 | $188,200 |
| 2018 | $3,945 | $208,600 | $36,800 | $171,800 |
| 2017 | $3,742 | $194,700 | $36,800 | $157,900 |
| 2016 | $3,821 | $185,400 | $30,100 | $155,300 |
| 2015 | $3,721 | $185,400 | $30,100 | $155,300 |
| 2014 | $3,623 | $185,400 | $30,100 | $155,300 |
Source: Public Records
Map
Nearby Homes
- 17 Mason St
- 15 Mason St
- 19 Mason St
- 196 Austin St
- 18 Mason St
- 20 Mason St
- 38 Bellevue St
- 44 Bellevue St
- 44 Bellevue St Unit 3
- 44 Bellevue St Unit 1
- 48 Bellevue St
- 40 Bellevue St
- 12 Mason St
- 26 Bellevue St
- 205 Chandler St
- 188 Austin St
- 41 Bellevue St
- 41 Bellevue St Unit 2
- 24 Bellevue St
- 215 Chandler St