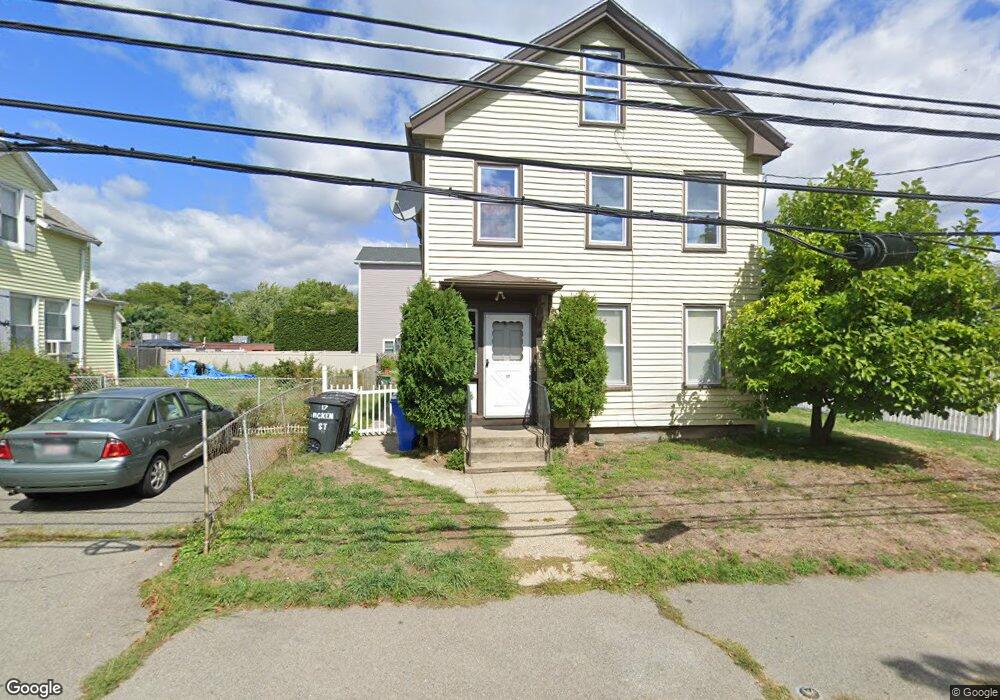
17 Mckenn St Unit 2 Waltham, MA 02453
South Side NeighborhoodEstimated Value: $915,000 - $1,031,000
4
Beds
2
Baths
1,500
Sq Ft
$649/Sq Ft
Est. Value
About This Home
This home is located at 17 Mckenn St Unit 2, Waltham, MA 02453 and is currently estimated at $973,872, approximately $649 per square foot. 17 Mckenn St Unit 2 is a home located in Middlesex County with nearby schools including Henry Whittemore Elementary School, John W. Mcdevitt Middle School, and Waltham Sr High School.
Ownership History
Date
Name
Owned For
Owner Type
Purchase Details
Closed on
Jun 26, 2003
Sold by
Marrero Jaime and Marrero Roxana
Bought by
Khoury Rafic I
Current Estimated Value
Home Financials for this Owner
Home Financials are based on the most recent Mortgage that was taken out on this home.
Original Mortgage
$318,000
Outstanding Balance
$137,946
Interest Rate
5.53%
Mortgage Type
Purchase Money Mortgage
Estimated Equity
$835,926
Purchase Details
Closed on
Mar 17, 2000
Sold by
Carlino Joseph and Carlino Cheryl
Bought by
Marrero Roxanna
Home Financials for this Owner
Home Financials are based on the most recent Mortgage that was taken out on this home.
Original Mortgage
$237,500
Interest Rate
8.24%
Mortgage Type
Purchase Money Mortgage
Purchase Details
Closed on
Sep 18, 1989
Sold by
Gentile David M
Bought by
Carlino Joseph M
Home Financials for this Owner
Home Financials are based on the most recent Mortgage that was taken out on this home.
Original Mortgage
$164,050
Interest Rate
9.58%
Mortgage Type
Purchase Money Mortgage
Create a Home Valuation Report for This Property
The Home Valuation Report is an in-depth analysis detailing your home's value as well as a comparison with similar homes in the area
Home Values in the Area
Average Home Value in this Area
Purchase History
| Date | Buyer | Sale Price | Title Company |
|---|---|---|---|
| Khoury Rafic I | $397,500 | -- | |
| Marrero Roxanna | $252,000 | -- | |
| Carlino Joseph M | $184,000 | -- |
Source: Public Records
Mortgage History
| Date | Status | Borrower | Loan Amount |
|---|---|---|---|
| Open | Khoury Rafic I | $318,000 | |
| Previous Owner | Carlino Joseph M | $70,000 | |
| Previous Owner | Carlino Joseph M | $238,320 | |
| Previous Owner | Carlino Joseph M | $237,500 | |
| Previous Owner | Carlino Joseph M | $164,050 |
Source: Public Records
Tax History Compared to Growth
Tax History
| Year | Tax Paid | Tax Assessment Tax Assessment Total Assessment is a certain percentage of the fair market value that is determined by local assessors to be the total taxable value of land and additions on the property. | Land | Improvement |
|---|---|---|---|---|
| 2025 | $7,585 | $772,400 | $353,500 | $418,900 |
| 2024 | $7,038 | $730,100 | $353,500 | $376,600 |
| 2023 | $7,050 | $683,100 | $322,000 | $361,100 |
| 2022 | $7,131 | $640,100 | $294,000 | $346,100 |
| 2021 | $6,679 | $590,000 | $266,000 | $324,000 |
| 2020 | $6,613 | $553,400 | $252,000 | $301,400 |
| 2019 | $6,268 | $495,100 | $249,500 | $245,600 |
| 2018 | $5,668 | $449,500 | $231,000 | $218,500 |
| 2017 | $5,382 | $428,500 | $210,000 | $218,500 |
| 2016 | $4,945 | $404,000 | $185,500 | $218,500 |
| 2015 | $4,764 | $362,800 | $182,000 | $180,800 |
Source: Public Records
Map
Nearby Homes
- 28-32 Calvary St
- 266-274 River St
- 240 River St
- 39 Clinton St Unit 2
- 39 Clinton St Unit 1
- 180 River St Unit 9
- 308 Newton St Unit 1
- 61 Hall St Unit 1
- 61 Hall St Unit 9
- 61 Hall St Unit 2
- 61 Hall St Unit 7
- 176 River St
- 312 Newton St Unit 1A
- 9 John St
- 81 Alder St
- 42 Alder St
- 7-11.5 Felton
- 138 Myrtle St Unit 2
- 162 Myrtle St Unit 1
- 47 Alder St Unit 6
- 17 Mckenn St
- 25 Mckenn St
- 10 Wall St Unit 12
- 10 Wall St Unit 2
- 29 Mckenn St Unit 1B
- 29 Mc Kenn St Unit 2
- 27 Mckenn St Unit 2
- 27 Mckenn St Unit 3
- 27-33 Mckenn St
- 16 Mckenn St Unit 18
- 9 Wall St Unit 11
- 9 Wall St
- 27 Whitcomb St
- 22 Mckenn St
- 14 Mckenn St Unit 2
- 31 Mckenn St Unit 2
- 31 Mckenn St Unit 31
- 33 Mckenn St Unit 33
- 145 Newton St Unit 2
- 145 Newton St Unit 3