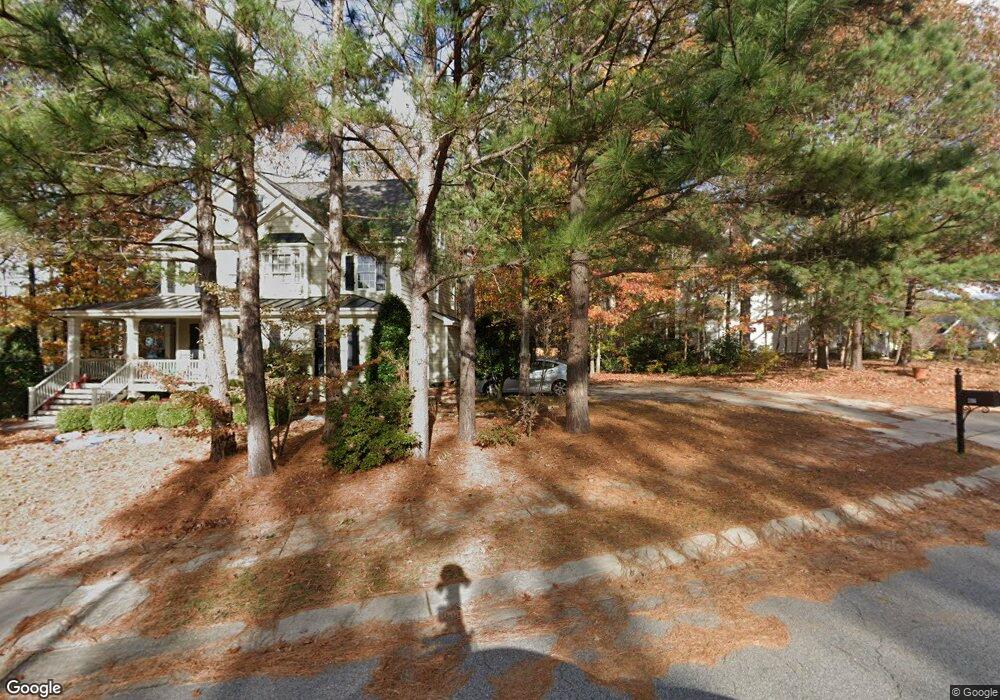
17 Middlecrest Way Clayton, NC 27527
Estimated Value: $489,928 - $564,000
3
Beds
3
Baths
2,417
Sq Ft
$214/Sq Ft
Est. Value
About This Home
This home is located at 17 Middlecrest Way, Clayton, NC 27527 and is currently estimated at $516,732, approximately $213 per square foot. 17 Middlecrest Way is a home located in Johnston County with nearby schools including Powhatan Elementary School, Riverwood Middle School, and Clayton High.
Ownership History
Date
Name
Owned For
Owner Type
Purchase Details
Closed on
Oct 13, 2020
Sold by
Miliano Vincent S and Miliano Tracy
Bought by
Miliano Vincent S and Miliano Tracy
Current Estimated Value
Home Financials for this Owner
Home Financials are based on the most recent Mortgage that was taken out on this home.
Original Mortgage
$266,500
Outstanding Balance
$237,038
Interest Rate
2.9%
Mortgage Type
New Conventional
Estimated Equity
$279,694
Purchase Details
Closed on
May 3, 2012
Sold by
Miliano Vincent S and Miliano Shawna Rae M
Bought by
Miliano Vincent S
Purchase Details
Closed on
Feb 13, 2007
Sold by
Veronelli Homes Inc
Bought by
Miliano Vincent S and Miliano Shawna Rae M
Home Financials for this Owner
Home Financials are based on the most recent Mortgage that was taken out on this home.
Original Mortgage
$339,133
Interest Rate
6.19%
Mortgage Type
Purchase Money Mortgage
Purchase Details
Closed on
Aug 23, 2006
Sold by
Glen Laurel Development Co Inc
Bought by
Veronelli Homes Inc
Create a Home Valuation Report for This Property
The Home Valuation Report is an in-depth analysis detailing your home's value as well as a comparison with similar homes in the area
Home Values in the Area
Average Home Value in this Area
Purchase History
| Date | Buyer | Sale Price | Title Company |
|---|---|---|---|
| Miliano Vincent S | -- | None Available | |
| Miliano Vincent S | -- | None Available | |
| Miliano Vincent S | $358,000 | None Available | |
| Veronelli Homes Inc | $59,000 | None Available |
Source: Public Records
Mortgage History
| Date | Status | Borrower | Loan Amount |
|---|---|---|---|
| Open | Miliano Vincent S | $266,500 | |
| Closed | Miliano Vincent S | $339,133 |
Source: Public Records
Tax History Compared to Growth
Tax History
| Year | Tax Paid | Tax Assessment Tax Assessment Total Assessment is a certain percentage of the fair market value that is determined by local assessors to be the total taxable value of land and additions on the property. | Land | Improvement |
|---|---|---|---|---|
| 2025 | $4,834 | $478,610 | $90,000 | $388,610 |
| 2024 | $4,513 | $341,880 | $61,000 | $280,880 |
| 2023 | $4,410 | $341,880 | $61,000 | $280,880 |
| 2022 | $4,547 | $341,880 | $61,000 | $280,880 |
| 2021 | $4,479 | $341,880 | $61,000 | $280,880 |
| 2020 | $4,957 | $341,880 | $61,000 | $280,880 |
| 2019 | $5,060 | $341,880 | $61,000 | $280,880 |
| 2018 | $4,246 | $312,220 | $50,000 | $262,220 |
| 2017 | $4,153 | $312,220 | $50,000 | $262,220 |
| 2016 | $4,153 | $312,220 | $50,000 | $262,220 |
| 2015 | $4,074 | $312,220 | $50,000 | $262,220 |
| 2014 | $4,074 | $312,220 | $50,000 | $262,220 |
Source: Public Records
Map
Nearby Homes
- 217 N Skymont Dr
- 205 Townsend Dr
- 222 S Stonehaven Way
- 152 Antler Steel Dr
- 47 Whitley Ridge Dr
- 103 S Stonehaven Way
- 116 Townsend Dr
- 69 S Stonehaven Way
- 104 Avenel Ln
- 31 W Copenhaver Dr
- 49 W Copenhaver Dr
- 90 Isabella Ct
- 154 Sicily Dr
- 239 Tuscan Ridge Way
- 221 Parkridge Dr
- 78 Florence Dr
- 57 Florence Dr
- 78 N Porcenna Ln
- 102 N Porcenna Ln
- 112 Castello Way
- 206 Skygrove Dr
- 206 Skygrove Dr Unit /67
- 191 Skygrove Dr
- 146 Skygrove Dr
- 146 Skygrove Dr Unit /68
- 151 Skygrove Dr
- 48 Riverglade Dr
- 43 Middlecrest Way
- 43 Middlecrest Way Unit /83
- 10 Middlecrest Way
- 137 Skygrove Dr
- 21 Riverglade Dr
- 122 Skygrove Dr
- 28 Middlecrest Way
- 66 Riverglade Dr
- 66 Riverglade Dr Unit /65
- 46 Middlecrest Way
- 41 Riverglade Dr
- 119 Skygrove Dr
- 67 Middlecrest Way