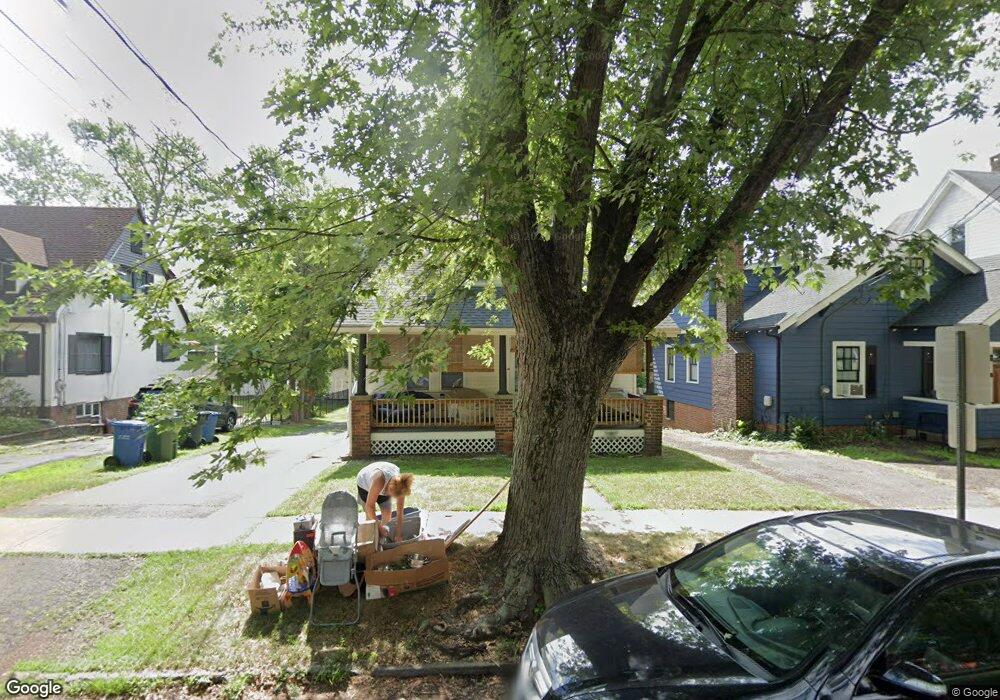
17 N Elm St Wallingford, CT 06492
Estimated Value: $387,000 - $412,732
3
Beds
2
Baths
1,360
Sq Ft
$293/Sq Ft
Est. Value
About This Home
This home is located at 17 N Elm St, Wallingford, CT 06492 and is currently estimated at $398,433, approximately $292 per square foot. 17 N Elm St is a home located in New Haven County with nearby schools including Moses Y Beach Elementary School, Rock Hill Elementary School, and Dag Hammarskjold Middle School.
Ownership History
Date
Name
Owned For
Owner Type
Purchase Details
Closed on
Aug 1, 2013
Sold by
Walton Philip
Bought by
Walton Properties Llc
Current Estimated Value
Purchase Details
Closed on
Jun 6, 2011
Sold by
Walton Props
Bought by
Walton Philip C
Home Financials for this Owner
Home Financials are based on the most recent Mortgage that was taken out on this home.
Original Mortgage
$152,000
Interest Rate
4.62%
Purchase Details
Closed on
Nov 13, 2009
Sold by
Walton Philip C and Walton Kristina L
Bought by
Walton Properties
Purchase Details
Closed on
Mar 28, 2008
Sold by
Peters Diane
Bought by
Walton Philip C and Walton Kristina L
Home Financials for this Owner
Home Financials are based on the most recent Mortgage that was taken out on this home.
Original Mortgage
$153,600
Interest Rate
5.76%
Create a Home Valuation Report for This Property
The Home Valuation Report is an in-depth analysis detailing your home's value as well as a comparison with similar homes in the area
Home Values in the Area
Average Home Value in this Area
Purchase History
| Date | Buyer | Sale Price | Title Company |
|---|---|---|---|
| Walton Properties Llc | -- | -- | |
| Walton Properties Llc | -- | -- | |
| Walton Philip C | -- | -- | |
| Walton Philip C | -- | -- | |
| Walton Properties | -- | -- | |
| Walton Properties | -- | -- | |
| Walton Philip C | $192,000 | -- | |
| Walton Philip C | $192,000 | -- |
Source: Public Records
Mortgage History
| Date | Status | Borrower | Loan Amount |
|---|---|---|---|
| Previous Owner | Walton Philip C | $152,000 | |
| Previous Owner | Walton Philip C | $153,600 |
Source: Public Records
Tax History
| Year | Tax Paid | Tax Assessment Tax Assessment Total Assessment is a certain percentage of the fair market value that is determined by local assessors to be the total taxable value of land and additions on the property. | Land | Improvement |
|---|---|---|---|---|
| 2025 | $5,849 | $242,500 | $90,700 | $151,800 |
| 2024 | $5,243 | $171,000 | $80,000 | $91,000 |
| 2023 | $5,017 | $171,000 | $80,000 | $91,000 |
| 2022 | $4,966 | $171,000 | $80,000 | $91,000 |
| 2021 | $4,877 | $171,000 | $80,000 | $91,000 |
| 2020 | $4,273 | $146,400 | $85,300 | $61,100 |
| 2019 | $4,157 | $142,400 | $85,300 | $57,100 |
| 2018 | $4,078 | $142,400 | $85,300 | $57,100 |
| 2017 | $4,066 | $142,400 | $85,300 | $57,100 |
| 2016 | $3,972 | $142,400 | $85,300 | $57,100 |
| 2015 | $3,912 | $142,400 | $85,300 | $57,100 |
| 2014 | $3,829 | $142,400 | $85,300 | $57,100 |
Source: Public Records
Map
Nearby Homes
- 17 Olde Village Cir Unit 17
- 85 N Colony St
- 147 Constitution St
- 319 S Main St
- 42 S Cherry St Unit 238
- 42 S Cherry St Unit 307
- 46 S Cherry St Unit 245
- 134 E Main St
- 120 S Cherry St
- 303 S Elm St Unit 303
- 311 S Elm St Unit A
- 83 Danny's Way
- 317 S Elm St Unit 317
- 54 Claremont Ave
- 28 Fairview Ave
- 27 Londonderry Dr
- 17 Kingsland Ave
- 116 Putter Dr Unit LL 12
- 96 Putter Dr Unit 510N
- 90 Putter Dr Unit 413
Your Personal Tour Guide
Ask me questions while you tour the home.