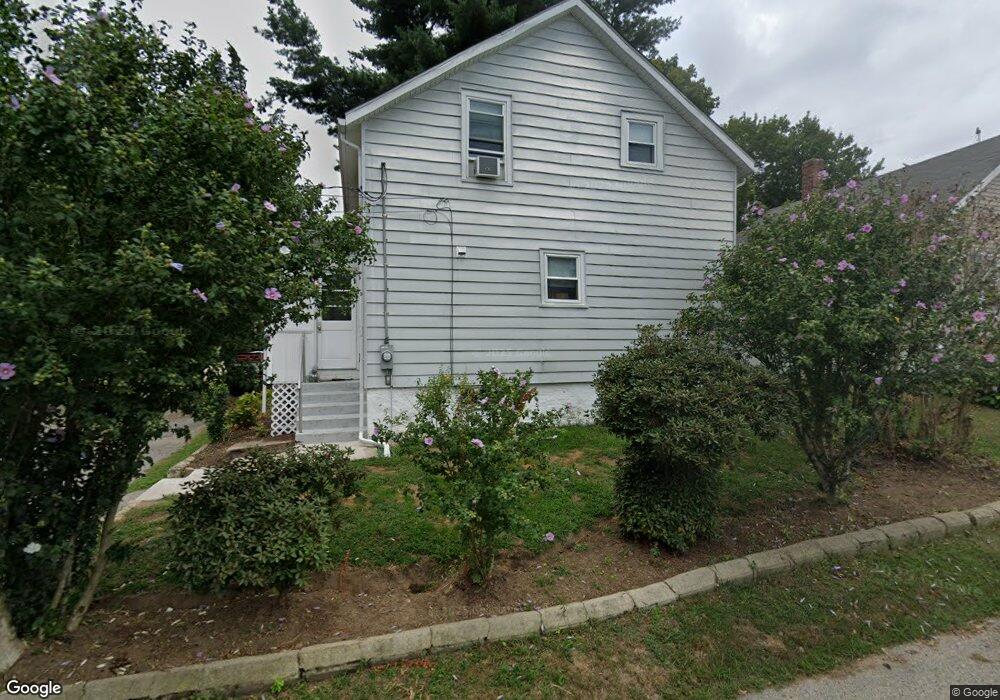
17 Nolan St West Warwick, RI 02893
West Warwick Centre NeighborhoodEstimated Value: $288,000 - $345,000
2
Beds
1
Bath
816
Sq Ft
$399/Sq Ft
Est. Value
About This Home
This home is located at 17 Nolan St, West Warwick, RI 02893 and is currently estimated at $325,915, approximately $399 per square foot. 17 Nolan St is a home located in Kent County with nearby schools including West Warwick High School.
Ownership History
Date
Name
Owned For
Owner Type
Purchase Details
Closed on
Dec 3, 2014
Sold by
Beauchaine Loretta C E
Bought by
Wholley James
Current Estimated Value
Purchase Details
Closed on
Sep 26, 2014
Sold by
Lanni Robet and Dumont Ronnie
Bought by
Monti Michael C and Montie Heather A
Home Financials for this Owner
Home Financials are based on the most recent Mortgage that was taken out on this home.
Original Mortgage
$106,043
Interest Rate
4.12%
Mortgage Type
New Conventional
Create a Home Valuation Report for This Property
The Home Valuation Report is an in-depth analysis detailing your home's value as well as a comparison with similar homes in the area
Home Values in the Area
Average Home Value in this Area
Purchase History
| Date | Buyer | Sale Price | Title Company |
|---|---|---|---|
| Wholley James | $45,000 | -- | |
| Monti Michael C | $108,000 | -- |
Source: Public Records
Mortgage History
| Date | Status | Borrower | Loan Amount |
|---|---|---|---|
| Previous Owner | Monti Michael C | $106,043 | |
| Previous Owner | Monti Michael C | $3,780 |
Source: Public Records
Tax History Compared to Growth
Tax History
| Year | Tax Paid | Tax Assessment Tax Assessment Total Assessment is a certain percentage of the fair market value that is determined by local assessors to be the total taxable value of land and additions on the property. | Land | Improvement |
|---|---|---|---|---|
| 2025 | $3,500 | $244,900 | $75,400 | $169,500 |
| 2024 | $3,534 | $189,100 | $47,900 | $141,200 |
| 2023 | $3,464 | $189,100 | $47,900 | $141,200 |
| 2022 | $3,411 | $189,100 | $47,900 | $141,200 |
| 2021 | $3,248 | $141,200 | $39,300 | $101,900 |
| 2020 | $3,248 | $141,200 | $39,300 | $101,900 |
| 2019 | $4,140 | $141,200 | $39,300 | $101,900 |
| 2018 | $2,851 | $104,900 | $36,900 | $68,000 |
| 2017 | $2,492 | $94,700 | $36,900 | $57,800 |
| 2016 | $2,447 | $94,700 | $36,900 | $57,800 |
| 2015 | $2,235 | $86,100 | $36,900 | $49,200 |
| 2014 | $504 | $86,100 | $36,900 | $49,200 |
Source: Public Records
Map
Nearby Homes