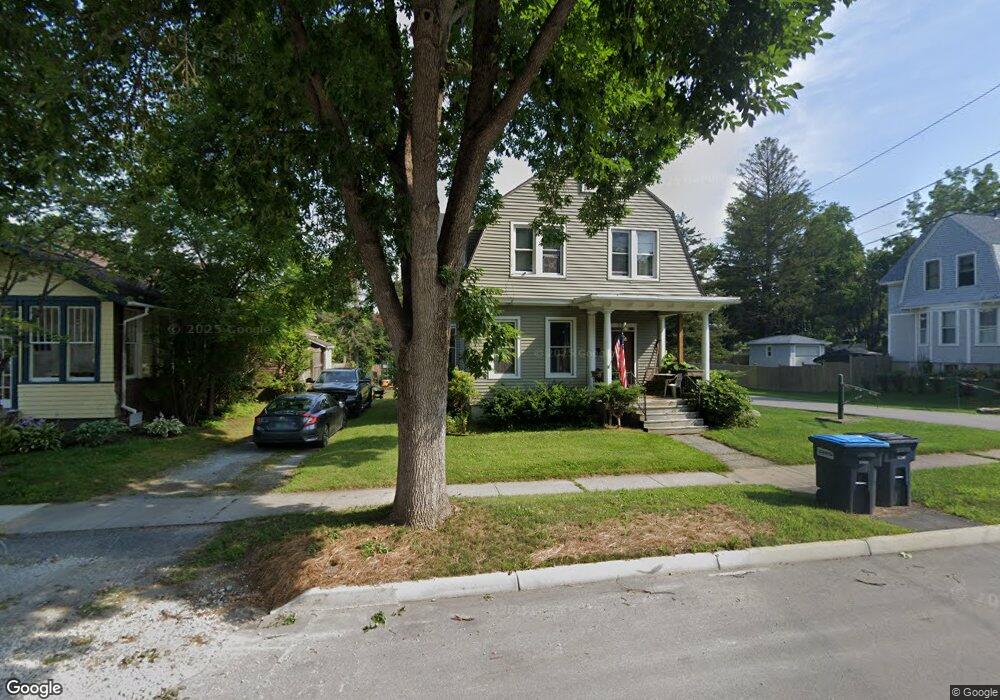
17 North St Rutland, VT 05701
Estimated Value: $230,000 - $328,000
--
Bed
--
Bath
--
Sq Ft
8,712
Sq Ft Lot
About This Home
This home is located at 17 North St, Rutland, VT 05701 and is currently estimated at $268,308. 17 North St is a home located in Rutland County with nearby schools including Rutland Intermediate School, Rutland Middle School, and Rutland Senior High School.
Ownership History
Date
Name
Owned For
Owner Type
Purchase Details
Closed on
Oct 31, 2022
Sold by
Spencer Susan A
Bought by
Spencer Scott A and Spencer Susan A
Current Estimated Value
Purchase Details
Closed on
Jan 17, 2014
Sold by
Jo Ann Hull Trustee Of The Joann Hull Tr
Bought by
Maclennan Susan
Purchase Details
Closed on
Sep 17, 2003
Sold by
Crandall Mary E and Crandall Arthur
Bought by
Hull Development Enterprises Inc
Purchase Details
Closed on
Mar 6, 2003
Sold by
Delehanty Janet H
Bought by
Delehanty Ronald C
Purchase Details
Closed on
Mar 31, 2000
Sold by
Ettori Sharon
Bought by
Delehanty Ronald and Delehanty Janet
Purchase Details
Closed on
Feb 28, 1992
Sold by
Tomasi John J and Tomasi Lena L
Bought by
Mayne Kevin M and Mayne Lisa H
Purchase Details
Closed on
Oct 7, 1987
Sold by
Tomasi Lena L
Bought by
Tomasi Lena L and Tomasi John J
Purchase Details
Closed on
Jun 2, 1987
Sold by
Crandall Mary E
Bought by
Crandall Mary E and Crandall Arthur J
Create a Home Valuation Report for This Property
The Home Valuation Report is an in-depth analysis detailing your home's value as well as a comparison with similar homes in the area
Home Values in the Area
Average Home Value in this Area
Purchase History
| Date | Buyer | Sale Price | Title Company |
|---|---|---|---|
| Spencer Scott A | -- | -- | |
| Spencer Scott A | -- | -- | |
| Spencer Scott A | -- | -- | |
| Maclennan Susan | -- | -- | |
| Hull Development Enterprises Inc | $129,000 | -- | |
| Hull Development Enterprises Inc | $129,000 | -- | |
| Delehanty Ronald C | -- | -- | |
| Delehanty Ronald C | -- | -- | |
| Delehanty Ronald | $188,000 | -- | |
| Delehanty Ronald | $188,000 | -- | |
| Mayne Kevin M | $140,000 | -- | |
| Mayne Kevin M | $140,000 | -- | |
| Tomasi Lena L | -- | -- | |
| Tomasi John J | -- | -- | |
| Tomasi John J | -- | -- | |
| Crandall Mary E | -- | -- | |
| Tomasi Lena L | -- | -- | |
| Crandall Mary E | -- | -- |
Source: Public Records
Tax History Compared to Growth
Tax History
| Year | Tax Paid | Tax Assessment Tax Assessment Total Assessment is a certain percentage of the fair market value that is determined by local assessors to be the total taxable value of land and additions on the property. | Land | Improvement |
|---|---|---|---|---|
| 2024 | -- | $116,400 | $40,800 | $75,600 |
| 2023 | -- | $116,400 | $40,800 | $75,600 |
| 2022 | $4,019 | $116,400 | $40,800 | $75,600 |
| 2021 | $3,970 | $116,400 | $40,800 | $75,600 |
| 2020 | $3,820 | $116,400 | $40,800 | $75,600 |
| 2019 | $3,934 | $116,400 | $40,800 | $75,600 |
| 2018 | $3,775 | $116,400 | $40,800 | $75,600 |
| 2017 | $3,577 | $116,400 | $40,800 | $75,600 |
| 2016 | $3,582 | $116,400 | $40,800 | $75,600 |
Source: Public Records
Map
Nearby Homes