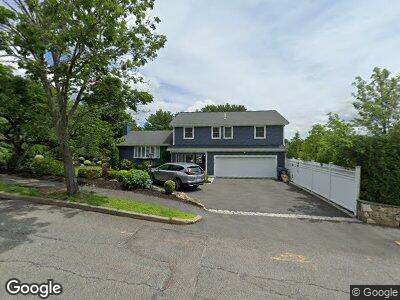
17 Ober Rd Newton Center, MA 02459
Oak Hill NeighborhoodEstimated Value: $1,749,000 - $1,820,000
3
Beds
3
Baths
2,250
Sq Ft
$792/Sq Ft
Est. Value
About This Home
This home is located at 17 Ober Rd, Newton Center, MA 02459 and is currently estimated at $1,782,852, approximately $792 per square foot. 17 Ober Rd is a home located in Middlesex County with nearby schools including Memorial Spaulding Elementary School, Oak Hill Middle School, and Newton South High School.
Ownership History
Date
Name
Owned For
Owner Type
Purchase Details
Closed on
Oct 30, 2006
Sold by
Treisman Rt and Treisman Oswald S
Bought by
Nissenbaum Mark and Nissenb Rosalind Patric
Current Estimated Value
Home Financials for this Owner
Home Financials are based on the most recent Mortgage that was taken out on this home.
Original Mortgage
$590,000
Interest Rate
6.48%
Mortgage Type
Purchase Money Mortgage
Create a Home Valuation Report for This Property
The Home Valuation Report is an in-depth analysis detailing your home's value as well as a comparison with similar homes in the area
Home Values in the Area
Average Home Value in this Area
Purchase History
| Date | Buyer | Sale Price | Title Company |
|---|---|---|---|
| Nissenbaum Mark | $737,500 | -- |
Source: Public Records
Mortgage History
| Date | Status | Borrower | Loan Amount |
|---|---|---|---|
| Open | Nissenbaum Mark | $150,000 | |
| Open | Nissenbaum Mark | $550,000 | |
| Closed | Nissenbaum Mark | $476,000 | |
| Closed | Nissenbaum Mark | $376,900 | |
| Closed | Nissenbaum Mark | $406,663 | |
| Closed | Treisman Oswald S | $417,000 | |
| Closed | Treisman Oswald S | $311,750 | |
| Closed | Nissenbaum Mark | $590,000 | |
| Closed | Nissenbaum Mark | $147,500 | |
| Previous Owner | Treisman Oswald S | $70,000 |
Source: Public Records
Tax History Compared to Growth
Tax History
| Year | Tax Paid | Tax Assessment Tax Assessment Total Assessment is a certain percentage of the fair market value that is determined by local assessors to be the total taxable value of land and additions on the property. | Land | Improvement |
|---|---|---|---|---|
| 2025 | $14,742 | $1,504,300 | $1,153,100 | $351,200 |
| 2024 | $14,254 | $1,460,500 | $1,119,500 | $341,000 |
| 2023 | $13,629 | $1,338,800 | $876,500 | $462,300 |
| 2022 | $13,041 | $1,239,600 | $811,600 | $428,000 |
| 2021 | $12,583 | $1,169,400 | $765,700 | $403,700 |
| 2020 | $10,504 | $1,006,100 | $765,700 | $240,400 |
| 2019 | $10,208 | $976,800 | $743,400 | $233,400 |
| 2018 | $9,687 | $895,300 | $676,600 | $218,700 |
| 2017 | $9,392 | $844,600 | $638,300 | $206,300 |
| 2016 | $8,982 | $789,300 | $596,500 | $192,800 |
| 2015 | $8,565 | $737,700 | $557,500 | $180,200 |
Source: Public Records
Map
Nearby Homes