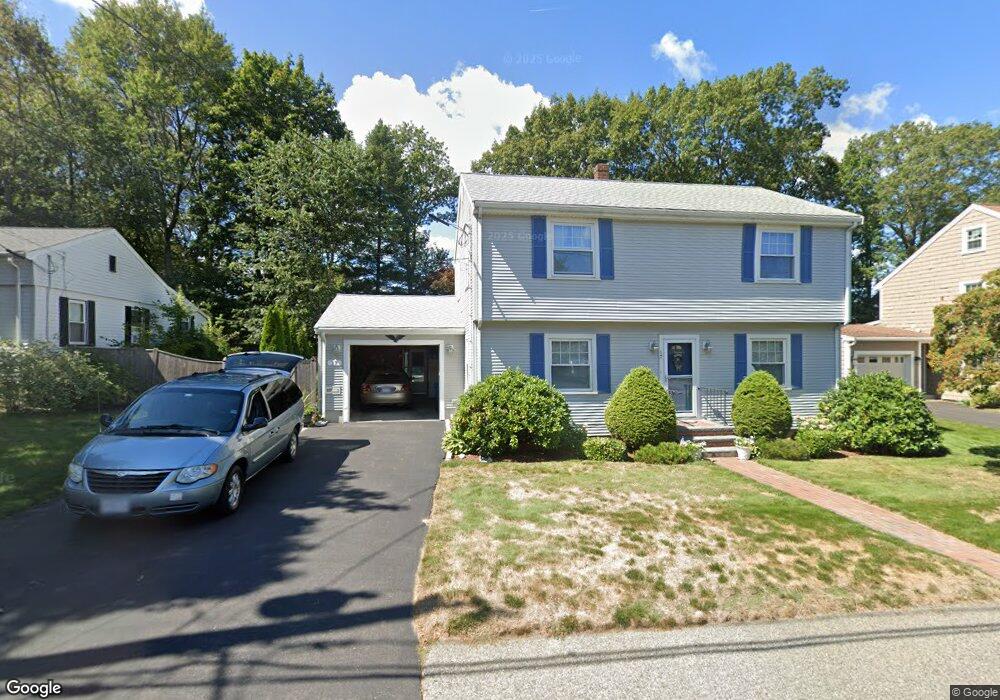
17 Olofson St Braintree, MA 02184
Braintree Highlands NeighborhoodEstimated Value: $700,000 - $801,000
3
Beds
2
Baths
1,584
Sq Ft
$468/Sq Ft
Est. Value
About This Home
This home is located at 17 Olofson St, Braintree, MA 02184 and is currently estimated at $740,741, approximately $467 per square foot. 17 Olofson St is a home located in Norfolk County with nearby schools including Braintree High School, Boston Higashi School, and Lighthouse Baptist Christian Academy.
Ownership History
Date
Name
Owned For
Owner Type
Purchase Details
Closed on
Aug 14, 2018
Sold by
Brickley Donna P
Bought by
Donna P Brickley Ret
Current Estimated Value
Purchase Details
Closed on
Apr 6, 2012
Sold by
Mowen Donna L and Brickley Donna P
Bought by
Brickley Donna P
Home Financials for this Owner
Home Financials are based on the most recent Mortgage that was taken out on this home.
Original Mortgage
$255,000
Interest Rate
3.95%
Mortgage Type
New Conventional
Create a Home Valuation Report for This Property
The Home Valuation Report is an in-depth analysis detailing your home's value as well as a comparison with similar homes in the area
Home Values in the Area
Average Home Value in this Area
Purchase History
| Date | Buyer | Sale Price | Title Company |
|---|---|---|---|
| Donna P Brickley Ret | -- | -- | |
| Brickley Donna P | -- | -- |
Source: Public Records
Mortgage History
| Date | Status | Borrower | Loan Amount |
|---|---|---|---|
| Previous Owner | Brickley Donna P | $255,000 |
Source: Public Records
Tax History
| Year | Tax Paid | Tax Assessment Tax Assessment Total Assessment is a certain percentage of the fair market value that is determined by local assessors to be the total taxable value of land and additions on the property. | Land | Improvement |
|---|---|---|---|---|
| 2025 | $6,721 | $673,400 | $362,100 | $311,300 |
| 2024 | $5,959 | $628,600 | $328,800 | $299,800 |
| 2023 | $5,659 | $579,800 | $295,400 | $284,400 |
| 2022 | $5,484 | $551,200 | $266,800 | $284,400 |
| 2021 | $5,075 | $510,100 | $241,100 | $269,000 |
| 2020 | $4,814 | $488,200 | $219,200 | $269,000 |
| 2019 | $4,554 | $451,300 | $209,700 | $241,600 |
| 2018 | $4,458 | $423,000 | $190,600 | $232,400 |
| 2017 | $4,341 | $404,200 | $181,100 | $223,100 |
| 2016 | $4,197 | $382,200 | $171,500 | $210,700 |
| 2015 | $3,830 | $346,000 | $143,000 | $203,000 |
| 2014 | $3,660 | $320,500 | $137,200 | $183,300 |
Source: Public Records
Map
Nearby Homes
- 24 Evelyn Ln
- 1696 Liberty St
- 129 Albee Dr
- 38 Roosevelt St
- 1579 Washington St
- 15 Alida Rd
- 1 Geraldine Ln
- 8 Dianthus Rd
- 23 Portland Rd
- 55 Bradford Commons Ln Unit 55
- 278 N Franklin St
- 169 Tyson Commons Ln
- 365 Tilden Commons Ln Unit 365
- 661 North St
- 43 Grove Cir
- 123-125 N Franklin St
- 972 Liberty St
- 5 Clarendon Cir Unit Lot 4
- 220 Weymouth St
- 107 Meadow Ln Unit 107
Your Personal Tour Guide
Ask me questions while you tour the home.