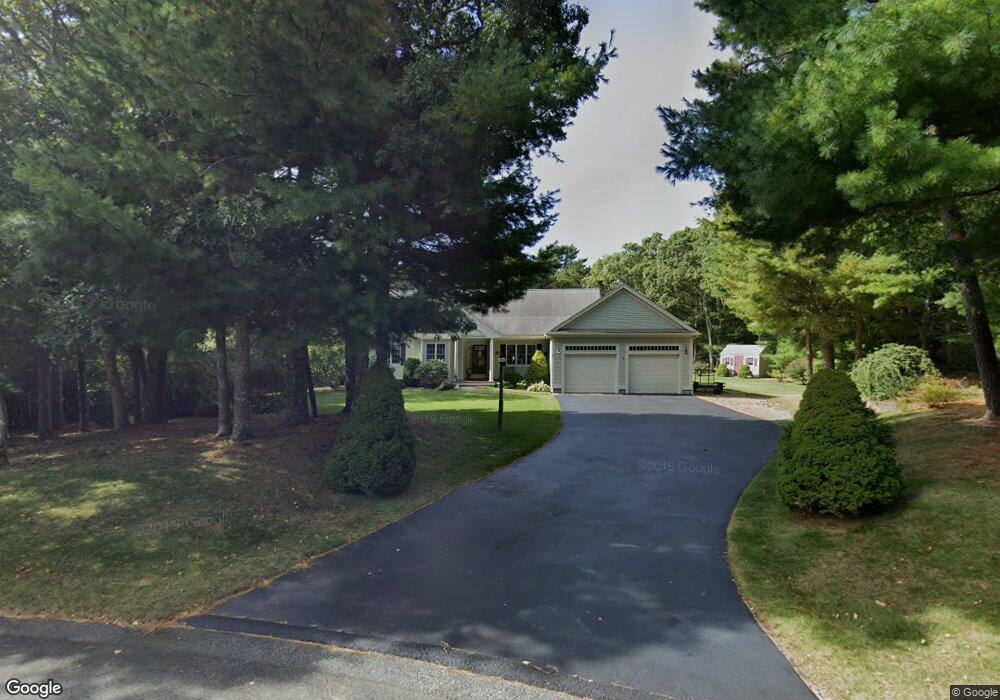
17 Penelope Rd Bourne, MA 02532
Monument Beach NeighborhoodEstimated Value: $715,000 - $752,000
3
Beds
3
Baths
1,801
Sq Ft
$406/Sq Ft
Est. Value
About This Home
This home is located at 17 Penelope Rd, Bourne, MA 02532 and is currently estimated at $730,421, approximately $405 per square foot. 17 Penelope Rd is a home located in Barnstable County with nearby schools including Bourne High School, Cadence Academy Preschool - Bourne, and St Margaret Regional School.
Ownership History
Date
Name
Owned For
Owner Type
Purchase Details
Closed on
Sep 4, 2002
Sold by
Old Centre Homes Rt and Cimeno J Scott
Bought by
Travis Robert M and Travis Jill E
Current Estimated Value
Home Financials for this Owner
Home Financials are based on the most recent Mortgage that was taken out on this home.
Original Mortgage
$40,000
Outstanding Balance
$16,892
Interest Rate
6.39%
Mortgage Type
Purchase Money Mortgage
Estimated Equity
$713,529
Create a Home Valuation Report for This Property
The Home Valuation Report is an in-depth analysis detailing your home's value as well as a comparison with similar homes in the area
Home Values in the Area
Average Home Value in this Area
Purchase History
| Date | Buyer | Sale Price | Title Company |
|---|---|---|---|
| Travis Robert M | $342,500 | -- | |
| Travis Robert M | $342,500 | -- |
Source: Public Records
Mortgage History
| Date | Status | Borrower | Loan Amount |
|---|---|---|---|
| Open | Travis Robert M | $40,000 | |
| Closed | Travis Robert M | $40,000 |
Source: Public Records
Tax History
| Year | Tax Paid | Tax Assessment Tax Assessment Total Assessment is a certain percentage of the fair market value that is determined by local assessors to be the total taxable value of land and additions on the property. | Land | Improvement |
|---|---|---|---|---|
| 2025 | $5,377 | $688,500 | $239,000 | $449,500 |
| 2024 | $5,298 | $660,600 | $227,600 | $433,000 |
| 2023 | $5,223 | $592,800 | $201,400 | $391,400 |
| 2022 | $4,952 | $490,800 | $178,200 | $312,600 |
| 2021 | $4,858 | $451,100 | $162,200 | $288,900 |
| 2020 | $4,731 | $440,500 | $160,700 | $279,800 |
| 2019 | $4,504 | $428,500 | $160,700 | $267,800 |
| 2018 | $4,133 | $392,100 | $145,800 | $246,300 |
| 2017 | $3,999 | $388,300 | $144,400 | $243,900 |
| 2016 | $3,812 | $375,200 | $137,200 | $238,000 |
| 2015 | $3,632 | $360,700 | $122,700 | $238,000 |
Source: Public Records
Map
Nearby Homes
- 566 Shore Rd
- 20 Colony Ave
- 5 Harbor Hill Dr
- 4 Harbor Hill Dr
- 16 Amberwood Ct
- 203 County Rd
- 14 Navajo Rd
- 709 County Rd
- 3 1st St
- 254 Barlows Landing Rd
- 12 Turnberry Rd Unit 12
- 3 4th Ave
- 7 4th Ave
- 16 Michael Rd
- 13 Laurel Hill Ct
- 2 Applewood Ct
- 4 Hollyhock Knoll Ct Unit 4
- 4 Hollyhock Knoll Ct Unit 4
- 5 Sea Knoll Ct
- 5 Zoli Ln
Your Personal Tour Guide
Ask me questions while you tour the home.