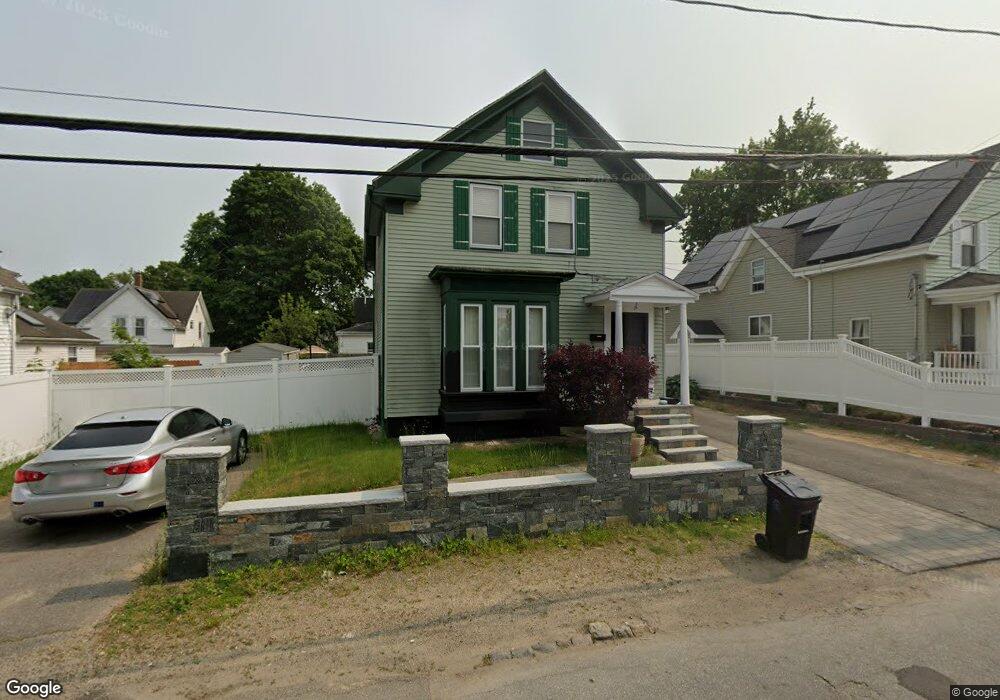
17 Pine Ave Brockton, MA 02302
Clifton Heights NeighborhoodEstimated Value: $451,103 - $486,000
3
Beds
2
Baths
1,362
Sq Ft
$341/Sq Ft
Est. Value
About This Home
This home is located at 17 Pine Ave, Brockton, MA 02302 and is currently estimated at $464,526, approximately $341 per square foot. 17 Pine Ave is a home located in Plymouth County with nearby schools including Gilmore Elementary School, John F. Kennedy Elementary School, and Davis K-8 School.
Ownership History
Date
Name
Owned For
Owner Type
Purchase Details
Closed on
Jan 6, 2004
Sold by
Marrow Eugene S
Bought by
Nelson Guy and Bin-Aime Marjorie
Current Estimated Value
Home Financials for this Owner
Home Financials are based on the most recent Mortgage that was taken out on this home.
Original Mortgage
$191,900
Interest Rate
5.86%
Mortgage Type
Purchase Money Mortgage
Create a Home Valuation Report for This Property
The Home Valuation Report is an in-depth analysis detailing your home's value as well as a comparison with similar homes in the area
Home Values in the Area
Average Home Value in this Area
Purchase History
| Date | Buyer | Sale Price | Title Company |
|---|---|---|---|
| Nelson Guy | $202,000 | -- |
Source: Public Records
Mortgage History
| Date | Status | Borrower | Loan Amount |
|---|---|---|---|
| Open | Nelson Guy | $199,000 | |
| Closed | Nelson Guy | $191,900 |
Source: Public Records
Tax History
| Year | Tax Paid | Tax Assessment Tax Assessment Total Assessment is a certain percentage of the fair market value that is determined by local assessors to be the total taxable value of land and additions on the property. | Land | Improvement |
|---|---|---|---|---|
| 2025 | $4,682 | $386,600 | $136,700 | $249,900 |
| 2024 | $4,592 | $382,000 | $136,700 | $245,300 |
| 2023 | $4,468 | $344,200 | $102,200 | $242,000 |
| 2022 | $4,442 | $318,000 | $92,700 | $225,300 |
| 2021 | $4,218 | $290,900 | $76,700 | $214,200 |
| 2020 | $3,863 | $255,000 | $72,300 | $182,700 |
| 2019 | $3,453 | $222,200 | $70,000 | $152,200 |
| 2018 | $3,361 | $209,300 | $70,000 | $139,300 |
| 2017 | $3,096 | $192,300 | $70,000 | $122,300 |
| 2016 | $2,955 | $170,200 | $67,800 | $102,400 |
| 2015 | $2,532 | $139,500 | $67,800 | $71,700 |
| 2014 | $2,547 | $140,500 | $67,800 | $72,700 |
Source: Public Records
Map
Nearby Homes
- 103 Clinton St
- 28 Clinton St
- 28 Grove Ave
- 24 E Chestnut St
- 23 E Chestnut St
- 112 Laureston St
- 107 N Leyden St
- 223 Clinton St Unit 16
- 25 Tremont St
- 936 Warren Ave
- 41 Riverview St
- 100 Concord St
- 60 Tremont St
- 65 Tremont St
- 809 Warren Ave
- 26 South St
- 15 Market St
- 18 Florence St
- 34 South St
- 4 Virginia Ave
Your Personal Tour Guide
Ask me questions while you tour the home.