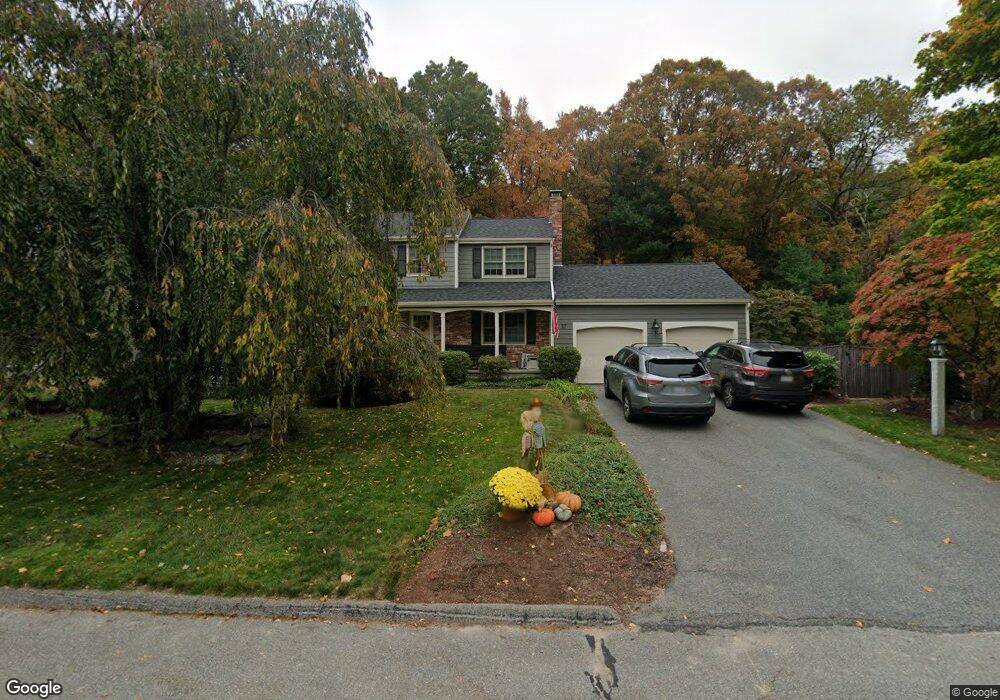
17 Pinecone Ln Southborough, MA 01772
Estimated Value: $868,314 - $1,032,000
5
Beds
3
Baths
2,076
Sq Ft
$456/Sq Ft
Est. Value
About This Home
This home is located at 17 Pinecone Ln, Southborough, MA 01772 and is currently estimated at $946,329, approximately $455 per square foot. 17 Pinecone Ln is a home located in Worcester County with nearby schools including Albert S. Woodward Memorial School, Margaret A. Neary School, and P. Brent Trottier Middle School.
Ownership History
Date
Name
Owned For
Owner Type
Purchase Details
Closed on
May 9, 2024
Sold by
Shea Brian E and Shea Anne M
Bought by
Brian Edward Shea Lt and Shea
Current Estimated Value
Purchase Details
Closed on
Dec 29, 1995
Sold by
Kooyoomjian Carl and Kooyoomjian Phyllis
Bought by
Shea Brian and Shea Anne
Create a Home Valuation Report for This Property
The Home Valuation Report is an in-depth analysis detailing your home's value as well as a comparison with similar homes in the area
Home Values in the Area
Average Home Value in this Area
Purchase History
| Date | Buyer | Sale Price | Title Company |
|---|---|---|---|
| Brian Edward Shea Lt | -- | None Available | |
| Brian Edward Shea Lt | -- | None Available | |
| Shea Brian | $309,250 | -- | |
| Shea Brian | $309,250 | -- |
Source: Public Records
Mortgage History
| Date | Status | Borrower | Loan Amount |
|---|---|---|---|
| Previous Owner | Shea Brian | $320,000 | |
| Previous Owner | Shea Brian | $227,000 | |
| Previous Owner | Shea Brian | $22,000 |
Source: Public Records
Tax History Compared to Growth
Tax History
| Year | Tax Paid | Tax Assessment Tax Assessment Total Assessment is a certain percentage of the fair market value that is determined by local assessors to be the total taxable value of land and additions on the property. | Land | Improvement |
|---|---|---|---|---|
| 2025 | $11,404 | $825,800 | $318,000 | $507,800 |
| 2024 | $10,670 | $767,100 | $313,600 | $453,500 |
| 2023 | $10,158 | $688,200 | $296,700 | $391,500 |
| 2022 | $9,607 | $590,100 | $258,200 | $331,900 |
| 2021 | $9,313 | $574,500 | $262,600 | $311,900 |
| 2020 | $9,336 | $560,400 | $252,300 | $308,100 |
| 2019 | $9,326 | $557,100 | $239,000 | $318,100 |
| 2018 | $8,725 | $540,600 | $229,900 | $310,700 |
| 2017 | $8,495 | $518,600 | $229,900 | $288,700 |
| 2016 | $8,631 | $545,600 | $230,400 | $315,200 |
| 2015 | $8,817 | $550,400 | $216,700 | $333,700 |
Source: Public Records
Map
Nearby Homes
- 58 Framingham Rd
- 150 Framingham Rd
- 36 E Main St
- 14 Wolfpen Ln
- lot 1 Sears Rd
- Lot 2 Quinn Rd
- 6 Witherbee Ln
- 1 Carriage Hill Cir Unit 1
- 7 John St
- 146 Framingham Rd
- 58 Pine Hill Rd
- 58 Walker St
- 38 William Onthank Ln
- 56 Country Ln
- 9 Cherry St
- 392 Farm Rd
- 39 Desimone Dr
- 21 William Onthank Ln
- 1 Blueberry Ln
- 14 Pinehill Rd